Sales & Customers Dashboards
eCommerce & Physical stores

Aubade sells underwears through two channels:
- eCommerce with Magento
- physical stores (using a PoS software named Cashmere)
Before the setup of Serenytics, the performance analysis was done with Excel files. Each update was very time-consuming (or expensive when done externally). And it was impossible to track daily KPIs (which can be useful when a new marketing campaign is launched for example). Moreover, each channel (web & PoS) was tracked independantly.
Having a better knowledge of the sales & customers data was a pre-requisite to setup a fidelity program. One focus was put on CAC (Customer Acquisition Cost) and LTV (Life Time value).
One important point was to setup these KPI without increasing the workload of the IT team.
In this project, one consulting company helped the customer to define its requirements for the KPIs and dashboards. And a Serenytics consultant created the dataflows and dashboards.
We have created several dataflows to import/clean/prepare the data and 6 dashboards to view the KPIs:
- Sales tracking (e.g. average annual expense by customer, share of revenue by contacts in base, average basket, by year, by country)
- Customers KPIs (e.g. average age by year, age by channel, gender share evolution)
- Purchasing behaviors (e.g. LTV, churn by cohort, share of customers buying only discounted products, purchase frequency, multi-channels customers)
- Products KPIs (e.g. seasonality patterns, revenue by product, by category, best pairs of products, content of most frequent baskets)
- Base of contacts KPI (e.g. new contacts by store, by year, by month, contactability rate)
- Customer segmentation (e.g. history of customer segmentation (frequent, active, dead, occasional), matrix of segmentation flows
All these dashboards are updated automatically every night. And each person involved in the project receives a daily report with the main indicators. In case there is an issue in the data flow, an email is sent to the person in charge.
We have setup a dataflow to import the data exported daily from two systems: Magento and Cashmere. Data for sales, customers, products and stores are loaded. To be compliant with GDPR, data is anonymized before being exported by the client.
As Serenytics comes with an SFTP server, an internal datawarehouse and jobs to load data from CSV files on SFTP, Aubade hasn't had to setup any server on its side. Regarding the number of rows, we have choosen to use an AWS Redshift datawarehouse.
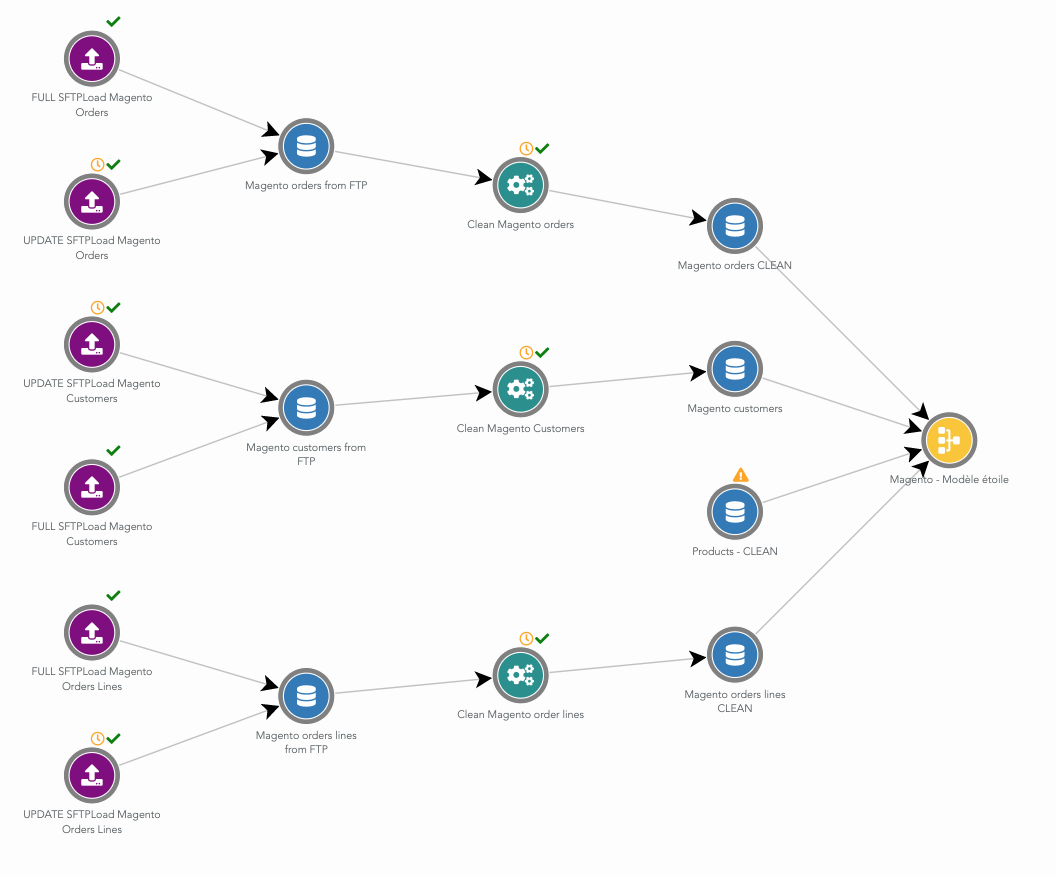
Here is an example of the dataflow to load and clean data from Magento:
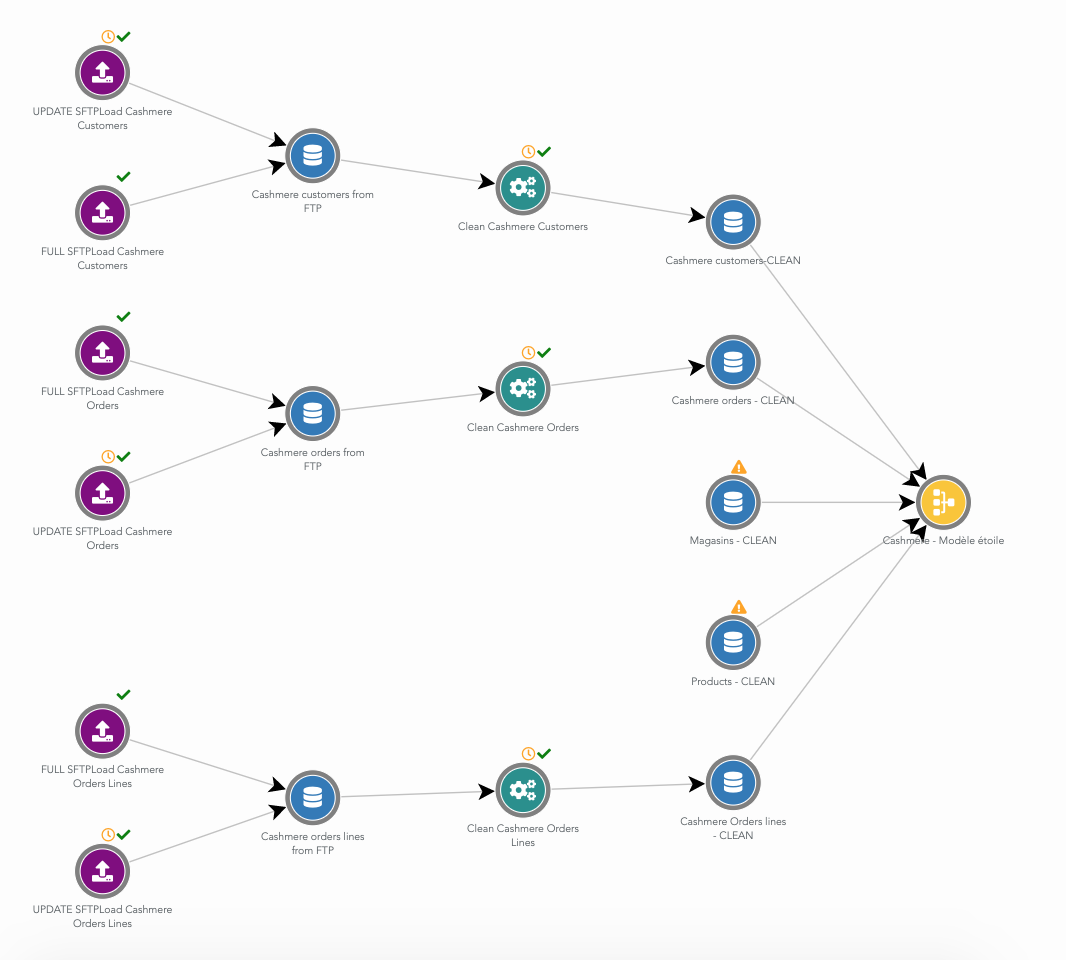
The Cashmere dataflow is very similar:
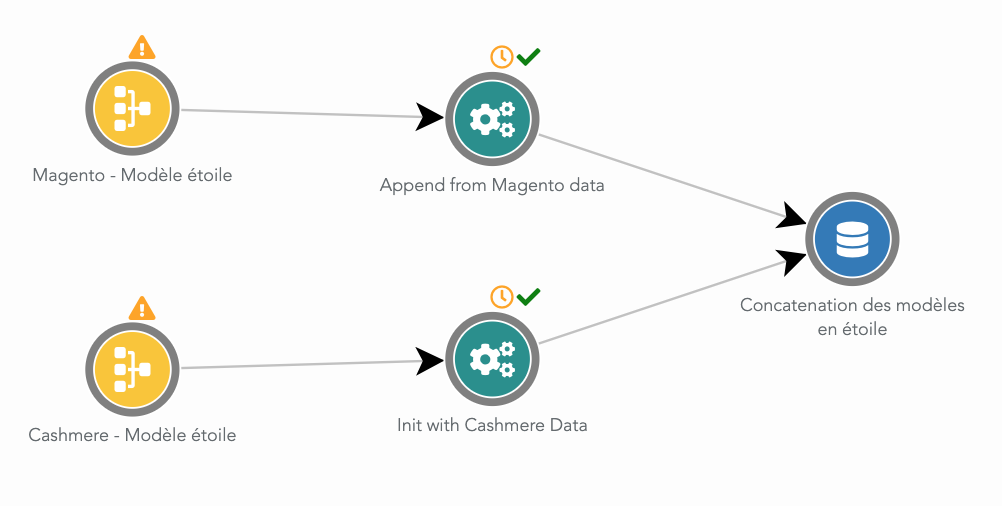
Then, we have setup a unified model between data from Magento and Cashmere. Mostly, this means renaming columns to common names for both systems. Then, all the rows from Magento and Cashmere using this unified model are gathered in a single table in the datawarehouse.
Here is this merge dataflow:
From this unified model table, we have built a second dataflow that generate a "golden customer" table. This table contains one row by customer. And for each row, we have many metrics about this customer behavior (e.g. first purchase date, last purchase date, LTV, rate of products bought in discount, last year purchases, Y-2 revenue). Then, the initial unified model table is joined to this 'golden customer' table (as a star model). We name this final table an 'enriched model'. This table contains one row by purchased product, with many columns about the product, the store, the customer.
All the dashboards are then built from this 'enriched model'. Using a single rich table makes it very easy to create advanced KPI.
All those dashboards are updated each night and allow exports in PDF, XLS, CSV, images. For example, CSV exports of the 'enriched model' allowed a data scientist to try more advanced models for segmentation/churn.
In the end, this project setup took a few weeks.
For confidentiatly reasons, dashboards and numbers cannot be shown on this page.
Because Serenytics is an all-in-one Saas (e.g. with an embedded datawarehouse and SFTP), the client haven't had to setup/manage anything on its side. So there is no additional workload for the IT team (and no additional budget).
Using an AWS Redshift datawarehouse allows to handle the large amount of rows of the project.
For this type of project, the data-preparation part takes two third of the time. Doing this data-preparation in the same software as the datavizualisation allows to be very efficient. The user can switch very quickly from a dataviz to its underlying datasource, and fix a dataprep issue. Some dashboards are created only to check the intermediate results, or to dig in the data. For this particular point, using one software for the dataprep (e.g. raw SQL queries), and another for visualization would be less efficient (especially if it implies several people).
For this project, the feature to split the dataflow in several "sub" dataflows, and to visualize them as graph is very useful. There is a dataflow for loading data from Magento, another one for Cashmere, a dataflow to merge these data, a dataflow to compute the Golden Customer table... It helps a lot when one has to work on the project a few months after it has been setup.
You want to know more on this type of project? Contact us at contact@serenytics.com.