How to add a button in a dashboard to run a Python script

In this tutorial, you will learn how to add a button in a dashboard that runs a Python script. The button can be added:
- in a table (one button per row). In this case, you can pass values from the table columns to the script as parameters.
- in a custom HTML widget.
As a very first step, create a Python script using the code below. We will use it in all our examples.
import serenytics
client = serenytics.Client()

print('Hello, Serenytics!')
print(client.script_args)
Then create a simple table in a dashboard:
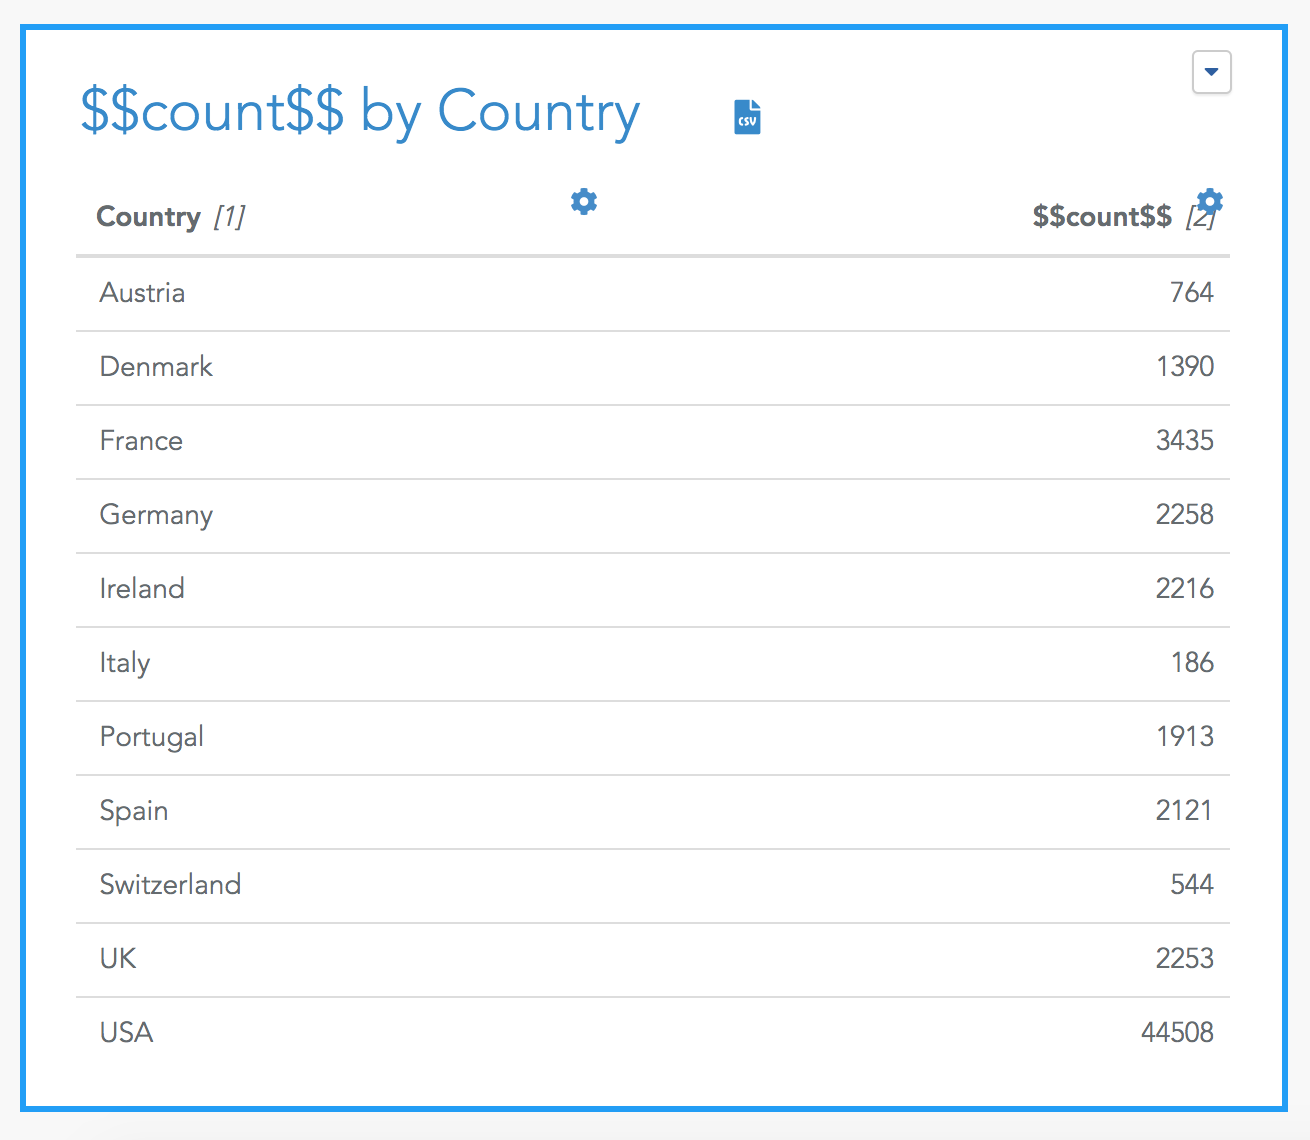
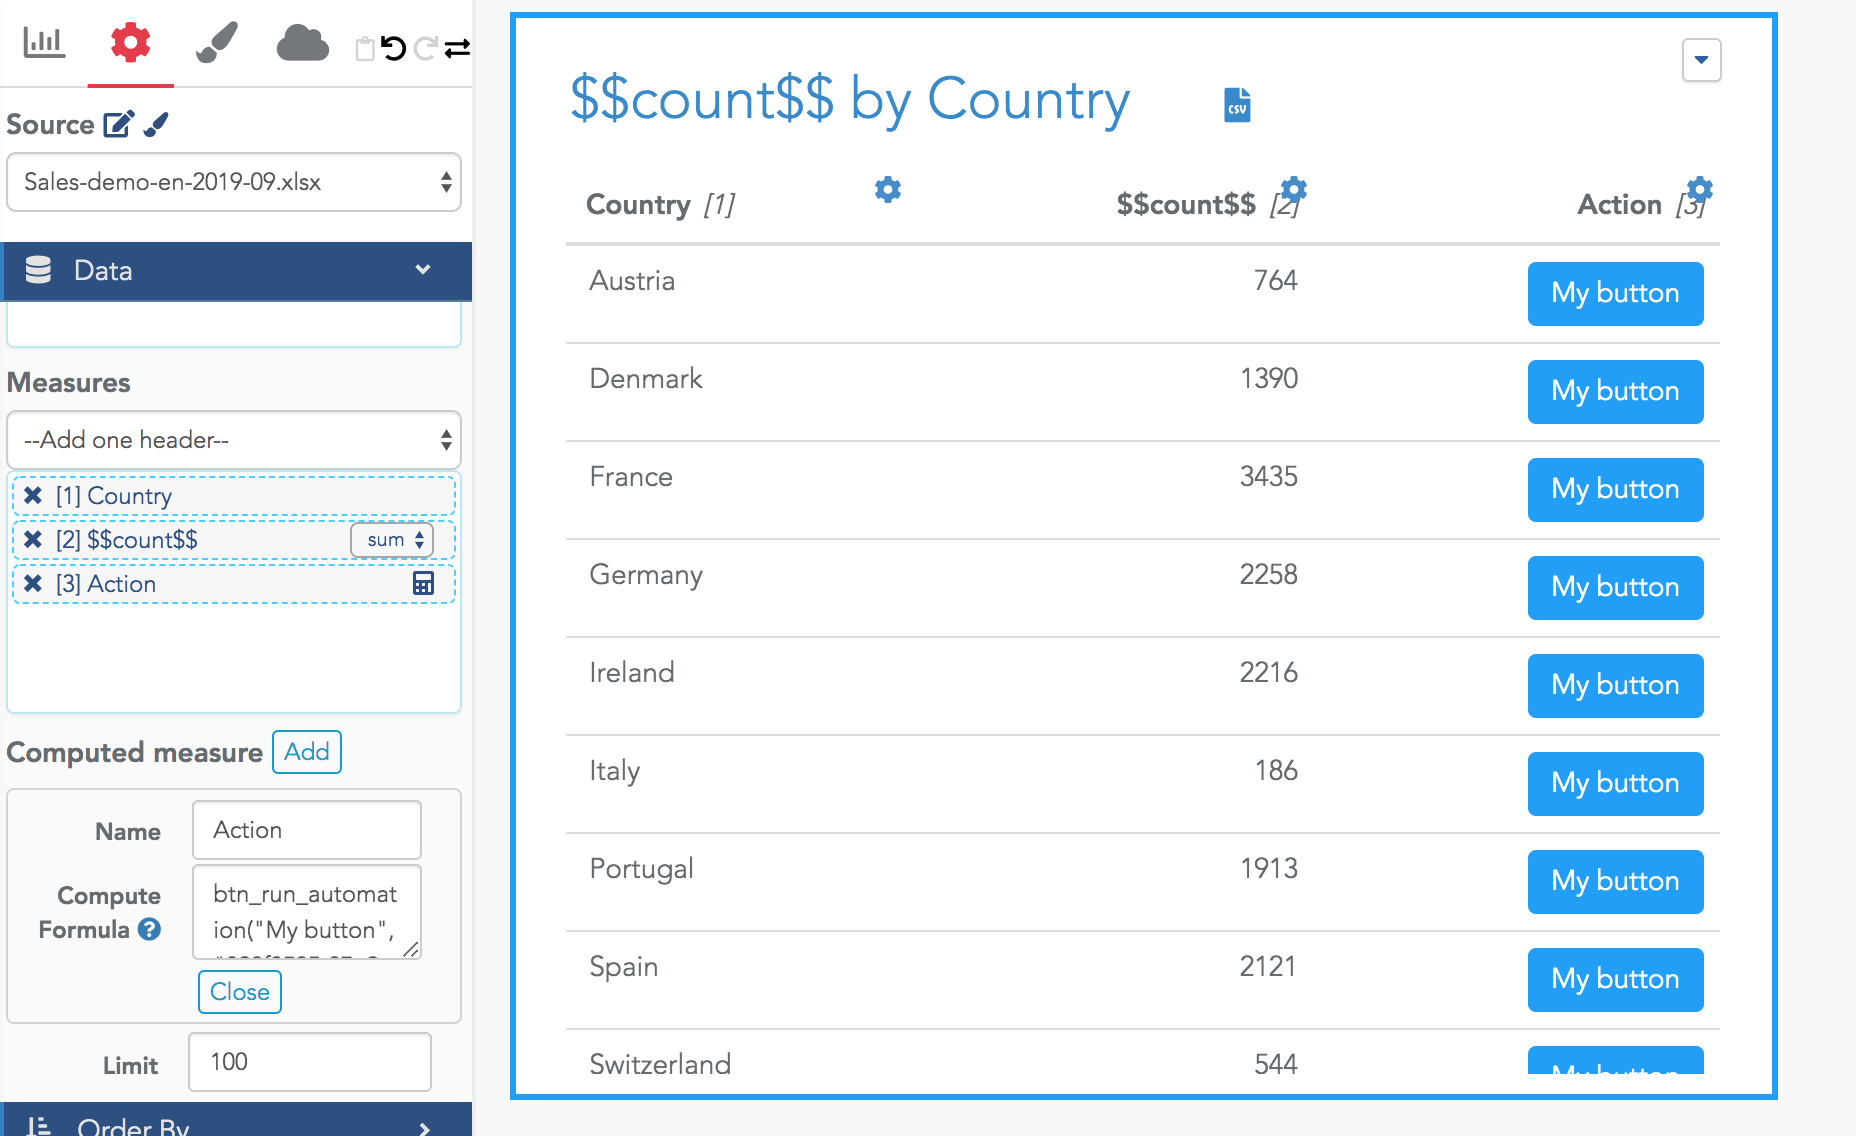
Here, we use this formula:
btn_run_automation("My button", "028f8585-07e9-4d48-b295-2cc67dcd2f41")
where "028f8585-07e9-4d48-b295-2cc67dcd2f41" is the unique identifier of the automation to run (in the script editor, you can get it either from the "script id" field or from the URL).Note that when creating the formula in the table, the input area is very small. It's easier to open the formatting option for the newly created column and edit the formula there.
You can test the process: click on the button and then open the Execution tab of your Python script. You will see it's been executed a few seconds ago:
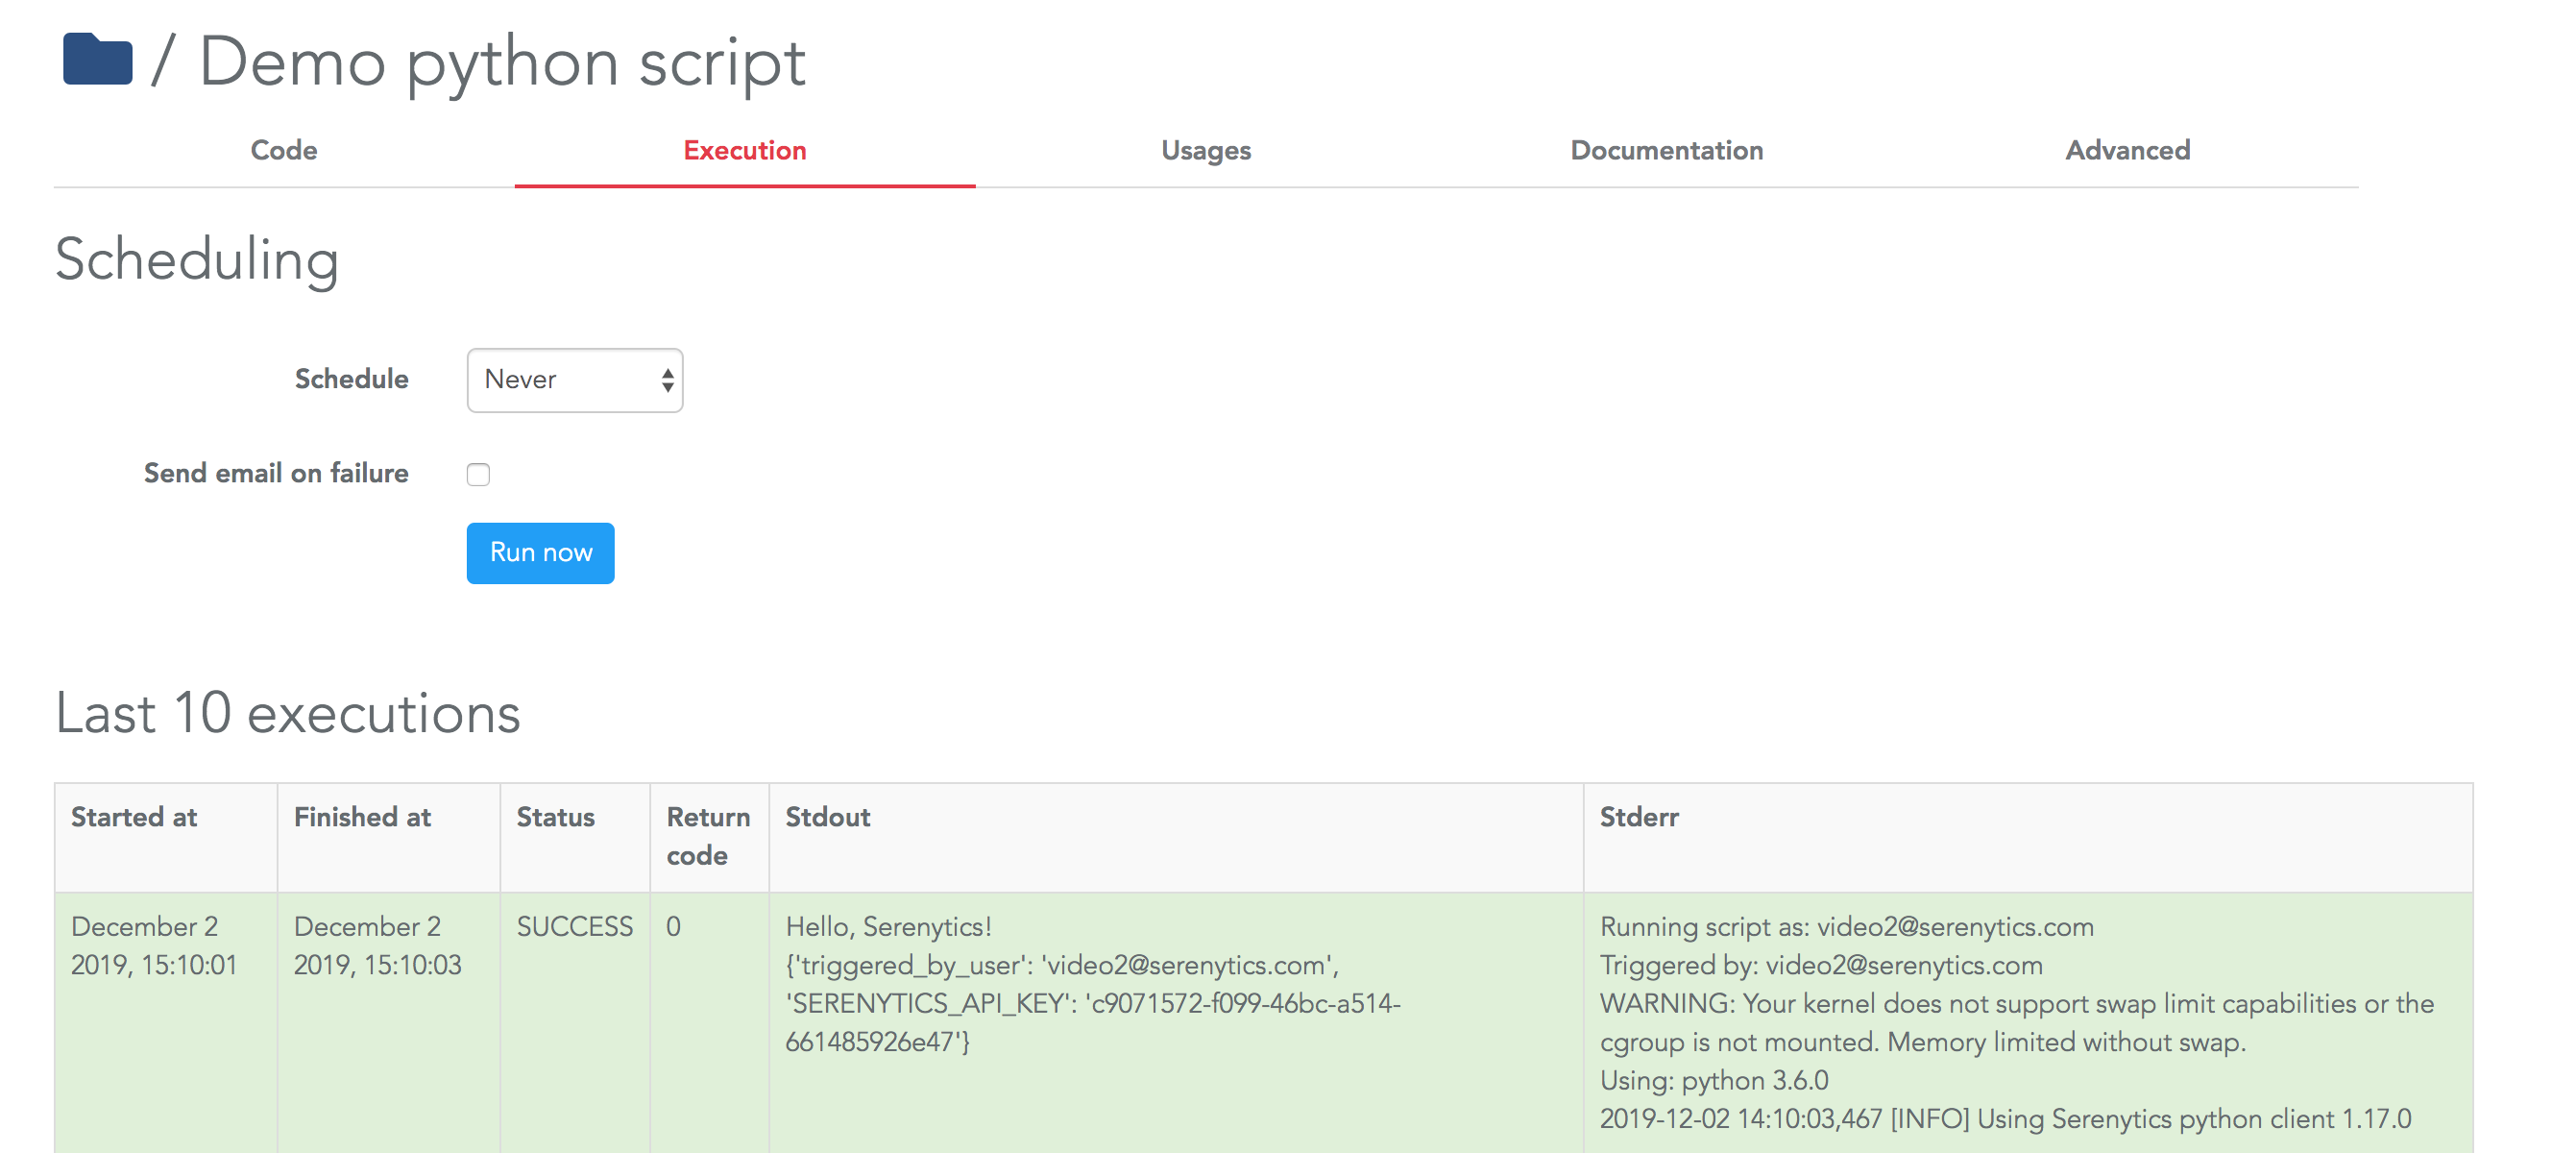
In the Python script used here, we printed the values of client.script_args. This value contains the parameters passed to the Python script. When executed from a dashboard, it contains the key "triggered_by_user". In the next paragraph, we show you how to add data from the table into these parameters.
btn_run_automation("My button", "028f8585-07e9-4d48-b295-2cc67dcd2f41",
"country", line[1],
"nb_of_purchases", line[2])
With this code, the execution log of the script shows (if I click on the "France" row of the table):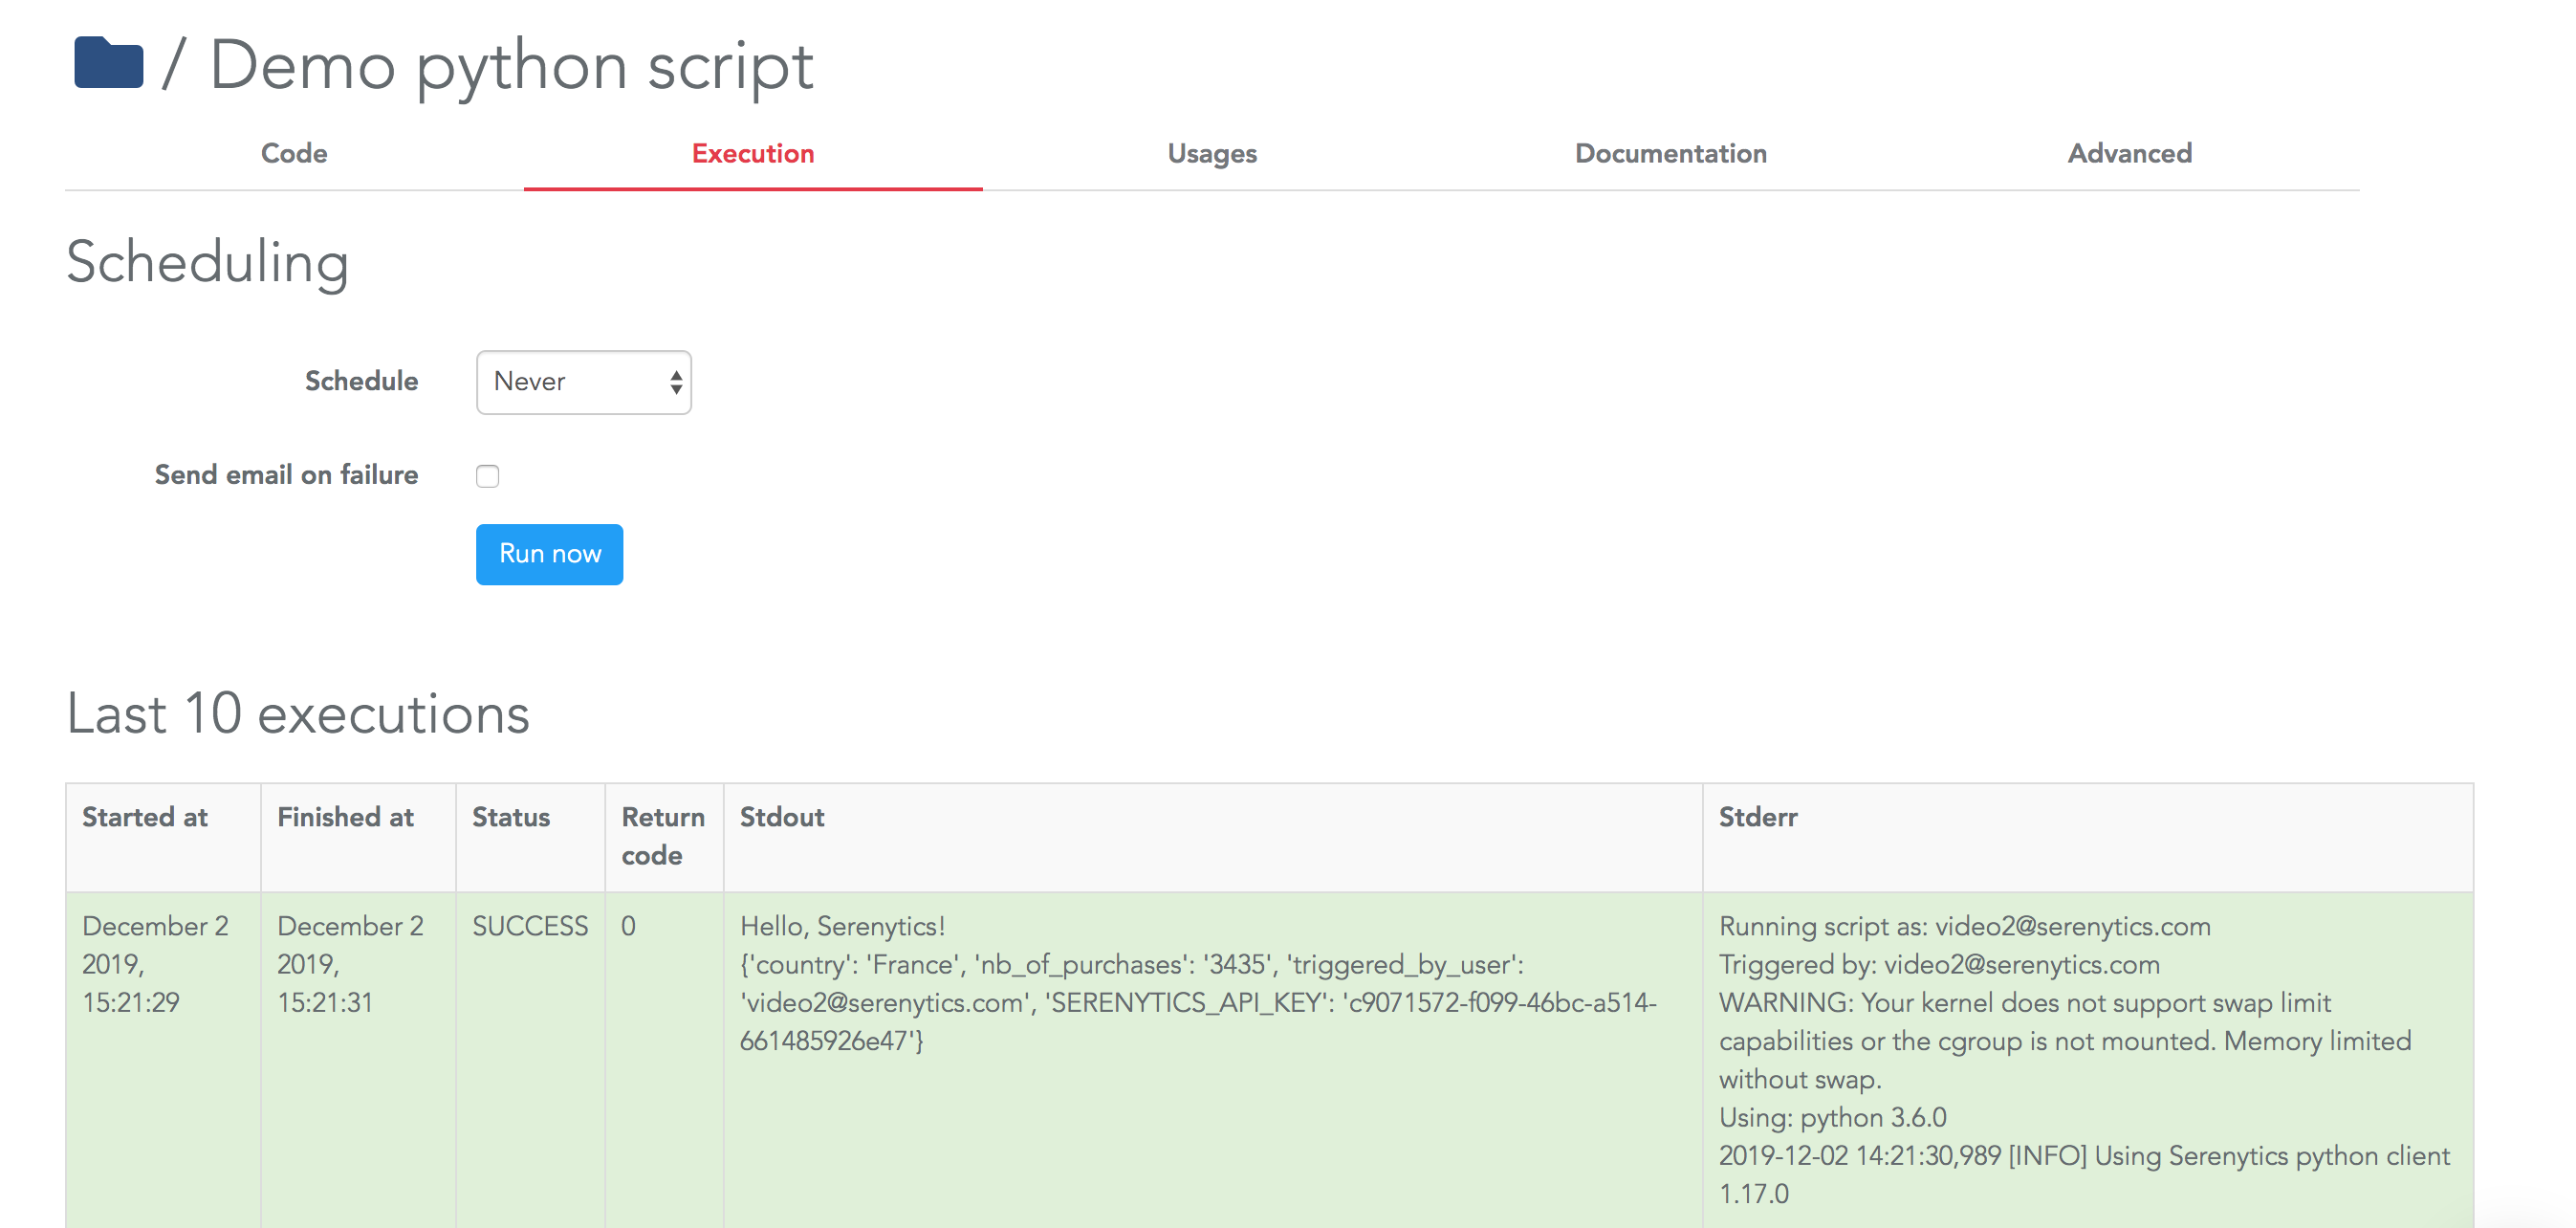
<button  class="btn btn-primary"
onclick="srnRunAutomation('028f8585-07e9-4d48-b295-2cc67dcd2f41',{'content':'my parameter'})">
My button
</button>
This creates a simple button: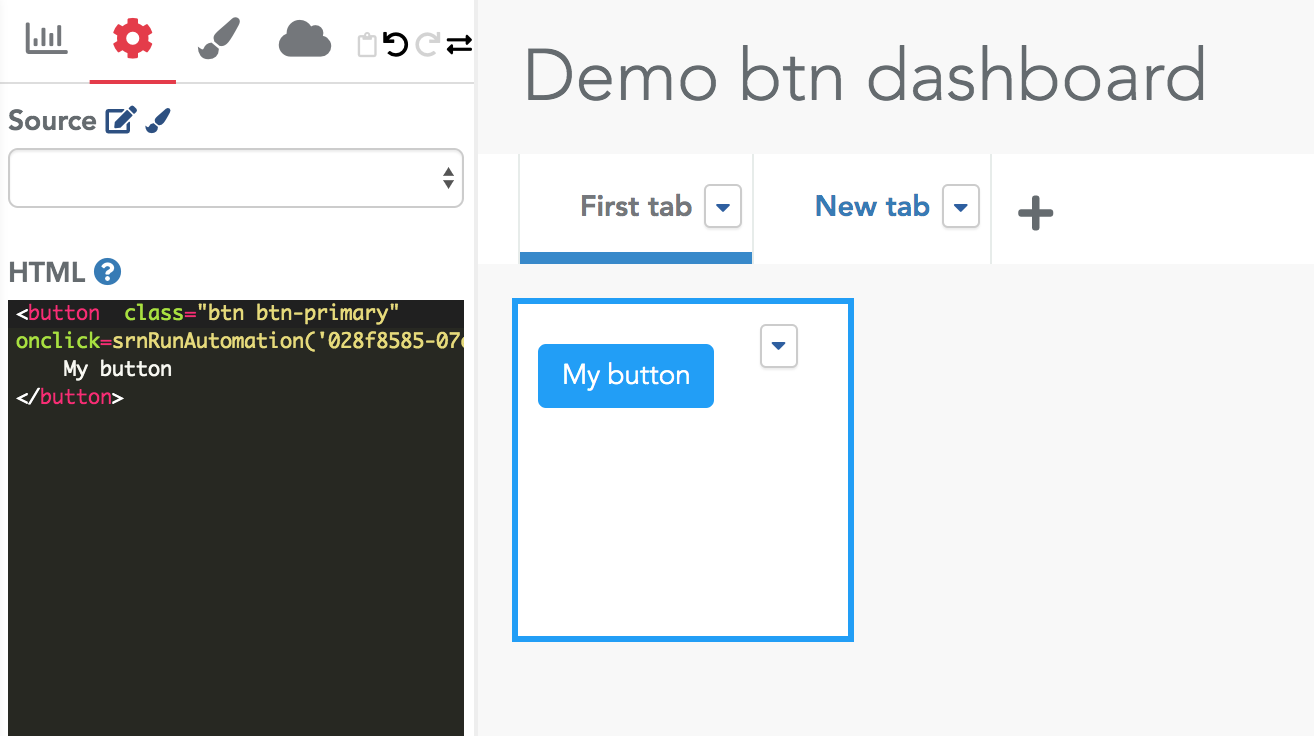
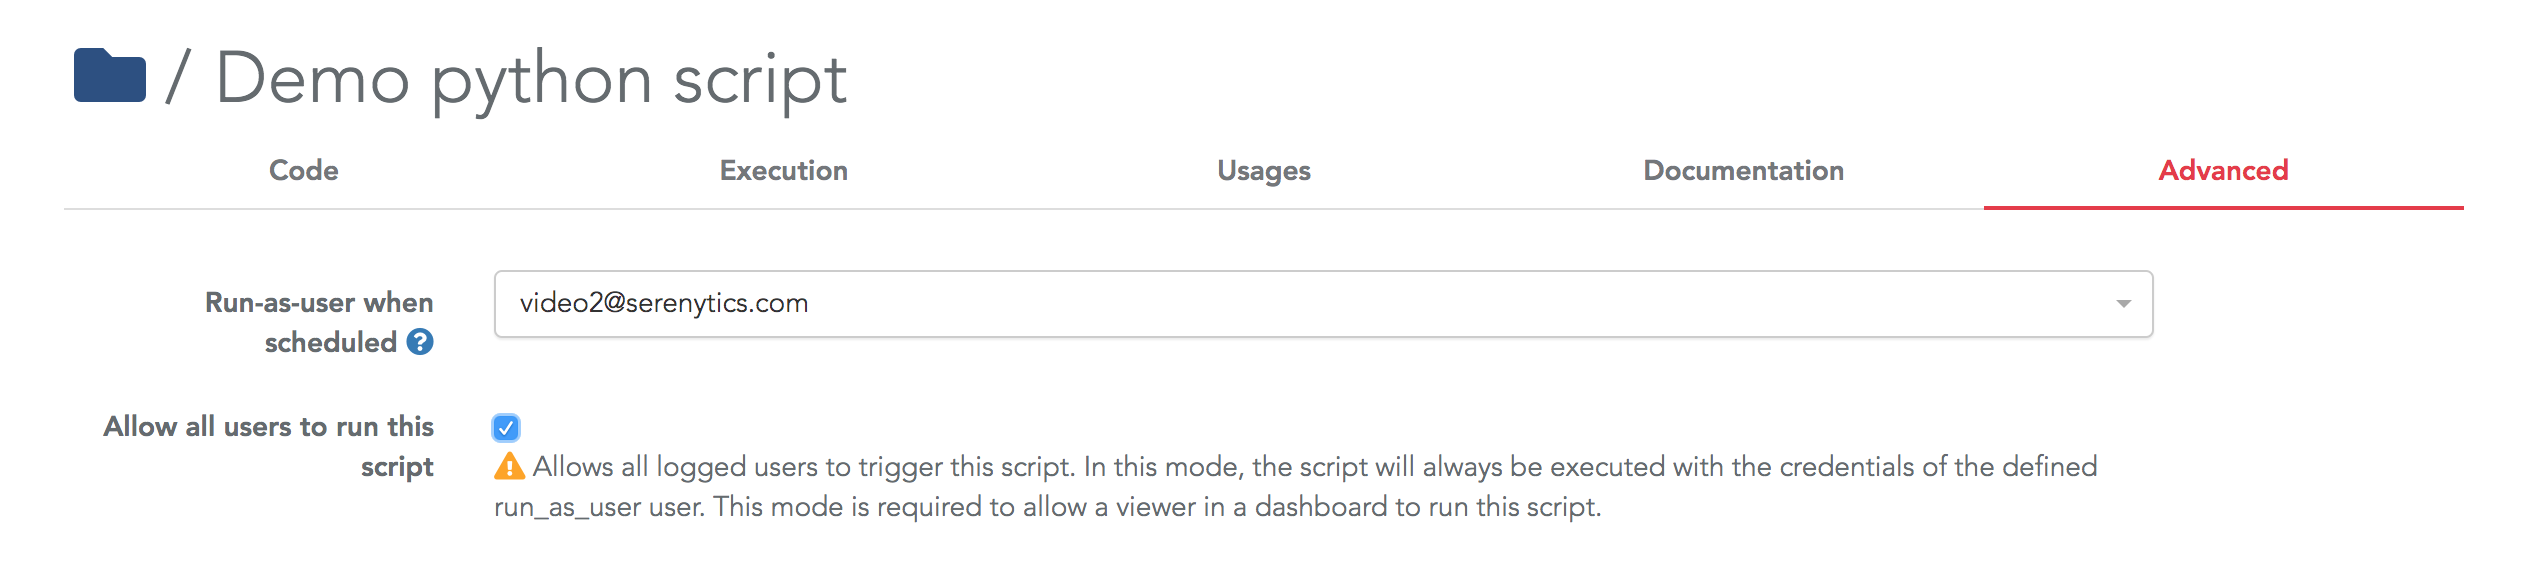
By default, the script will use the credentials of the user who clicked on the button. But in many cases, this user will be a Viewer and a Viewer cannot have credentials on a Python script (to be more precise, "on the folder containing a script").
To allow a given script to be executed by Viewers, you need to enable an option on the automation called "Allow all users to run this script":