Create a pivot table
Back to Tutorials

How to create a pivot table widget
Creating a pivot table in Serenytics is very simple. The first step is to add the widget by clicking on the pivot table icon:
Then, select the datasource to query data. When the datasource is selected, the full configuration menu is available.
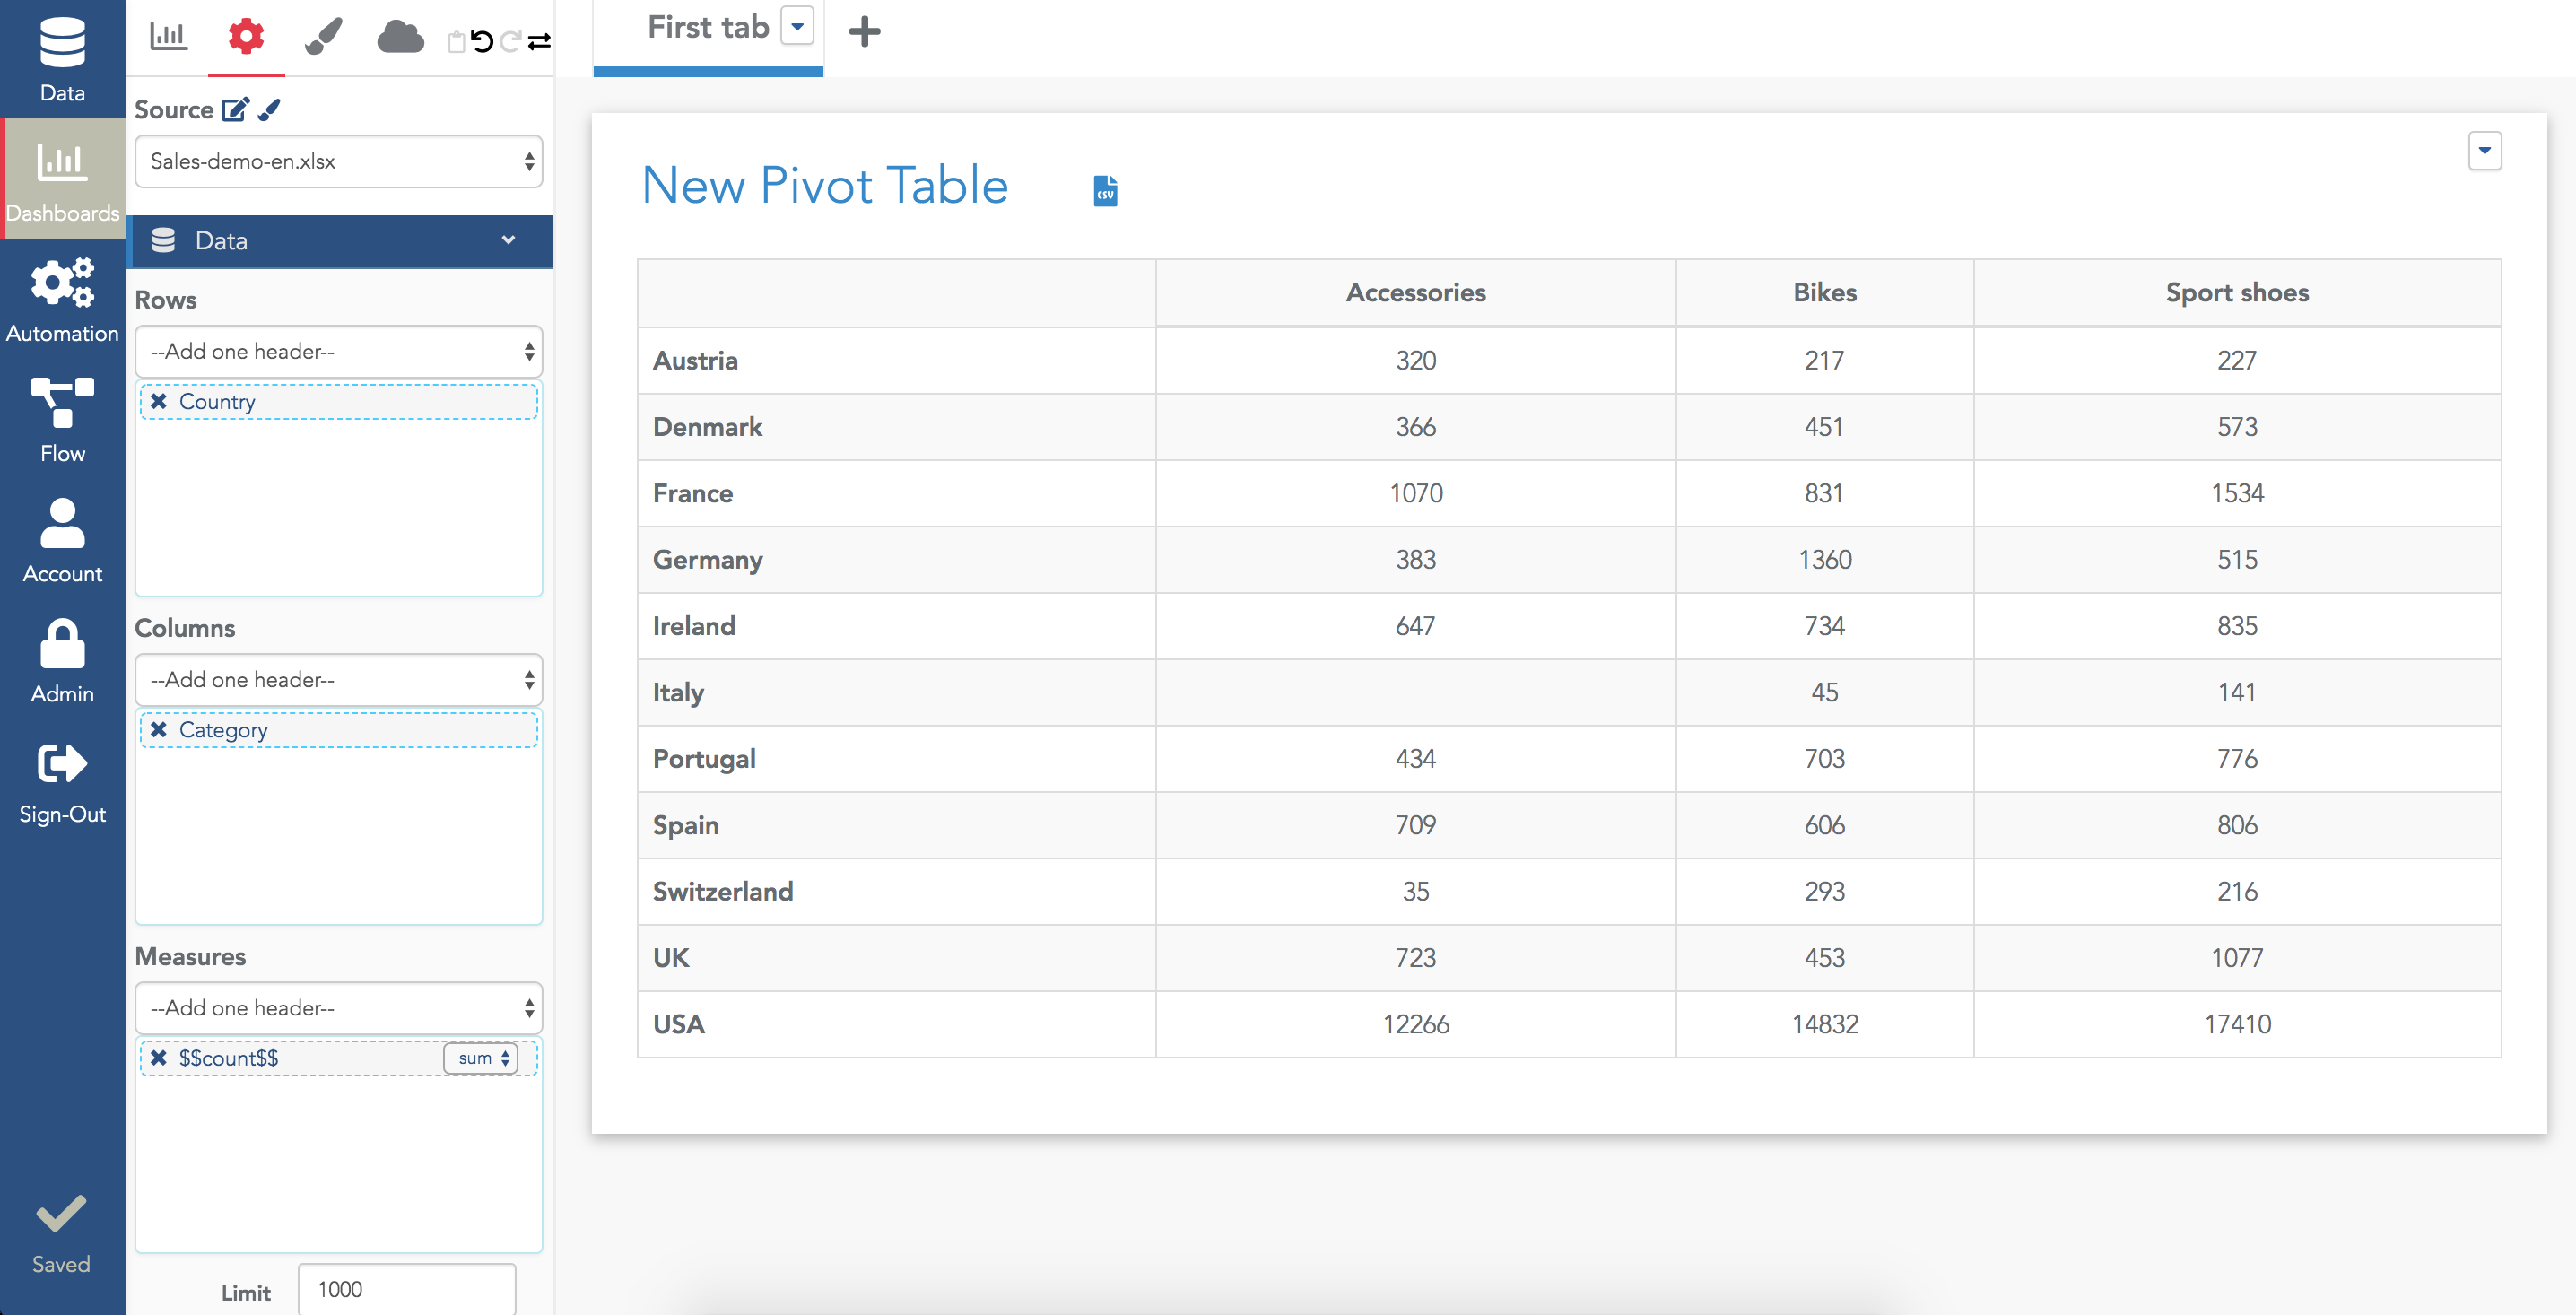
You need to select at least one dimension in the Rows selector, one dimension in the Columns selector and one metric in the Measures selector. Here is an example where Country is used as a rows dimension, Category is used as a columns dimension and $$count$$ is used as the measure:
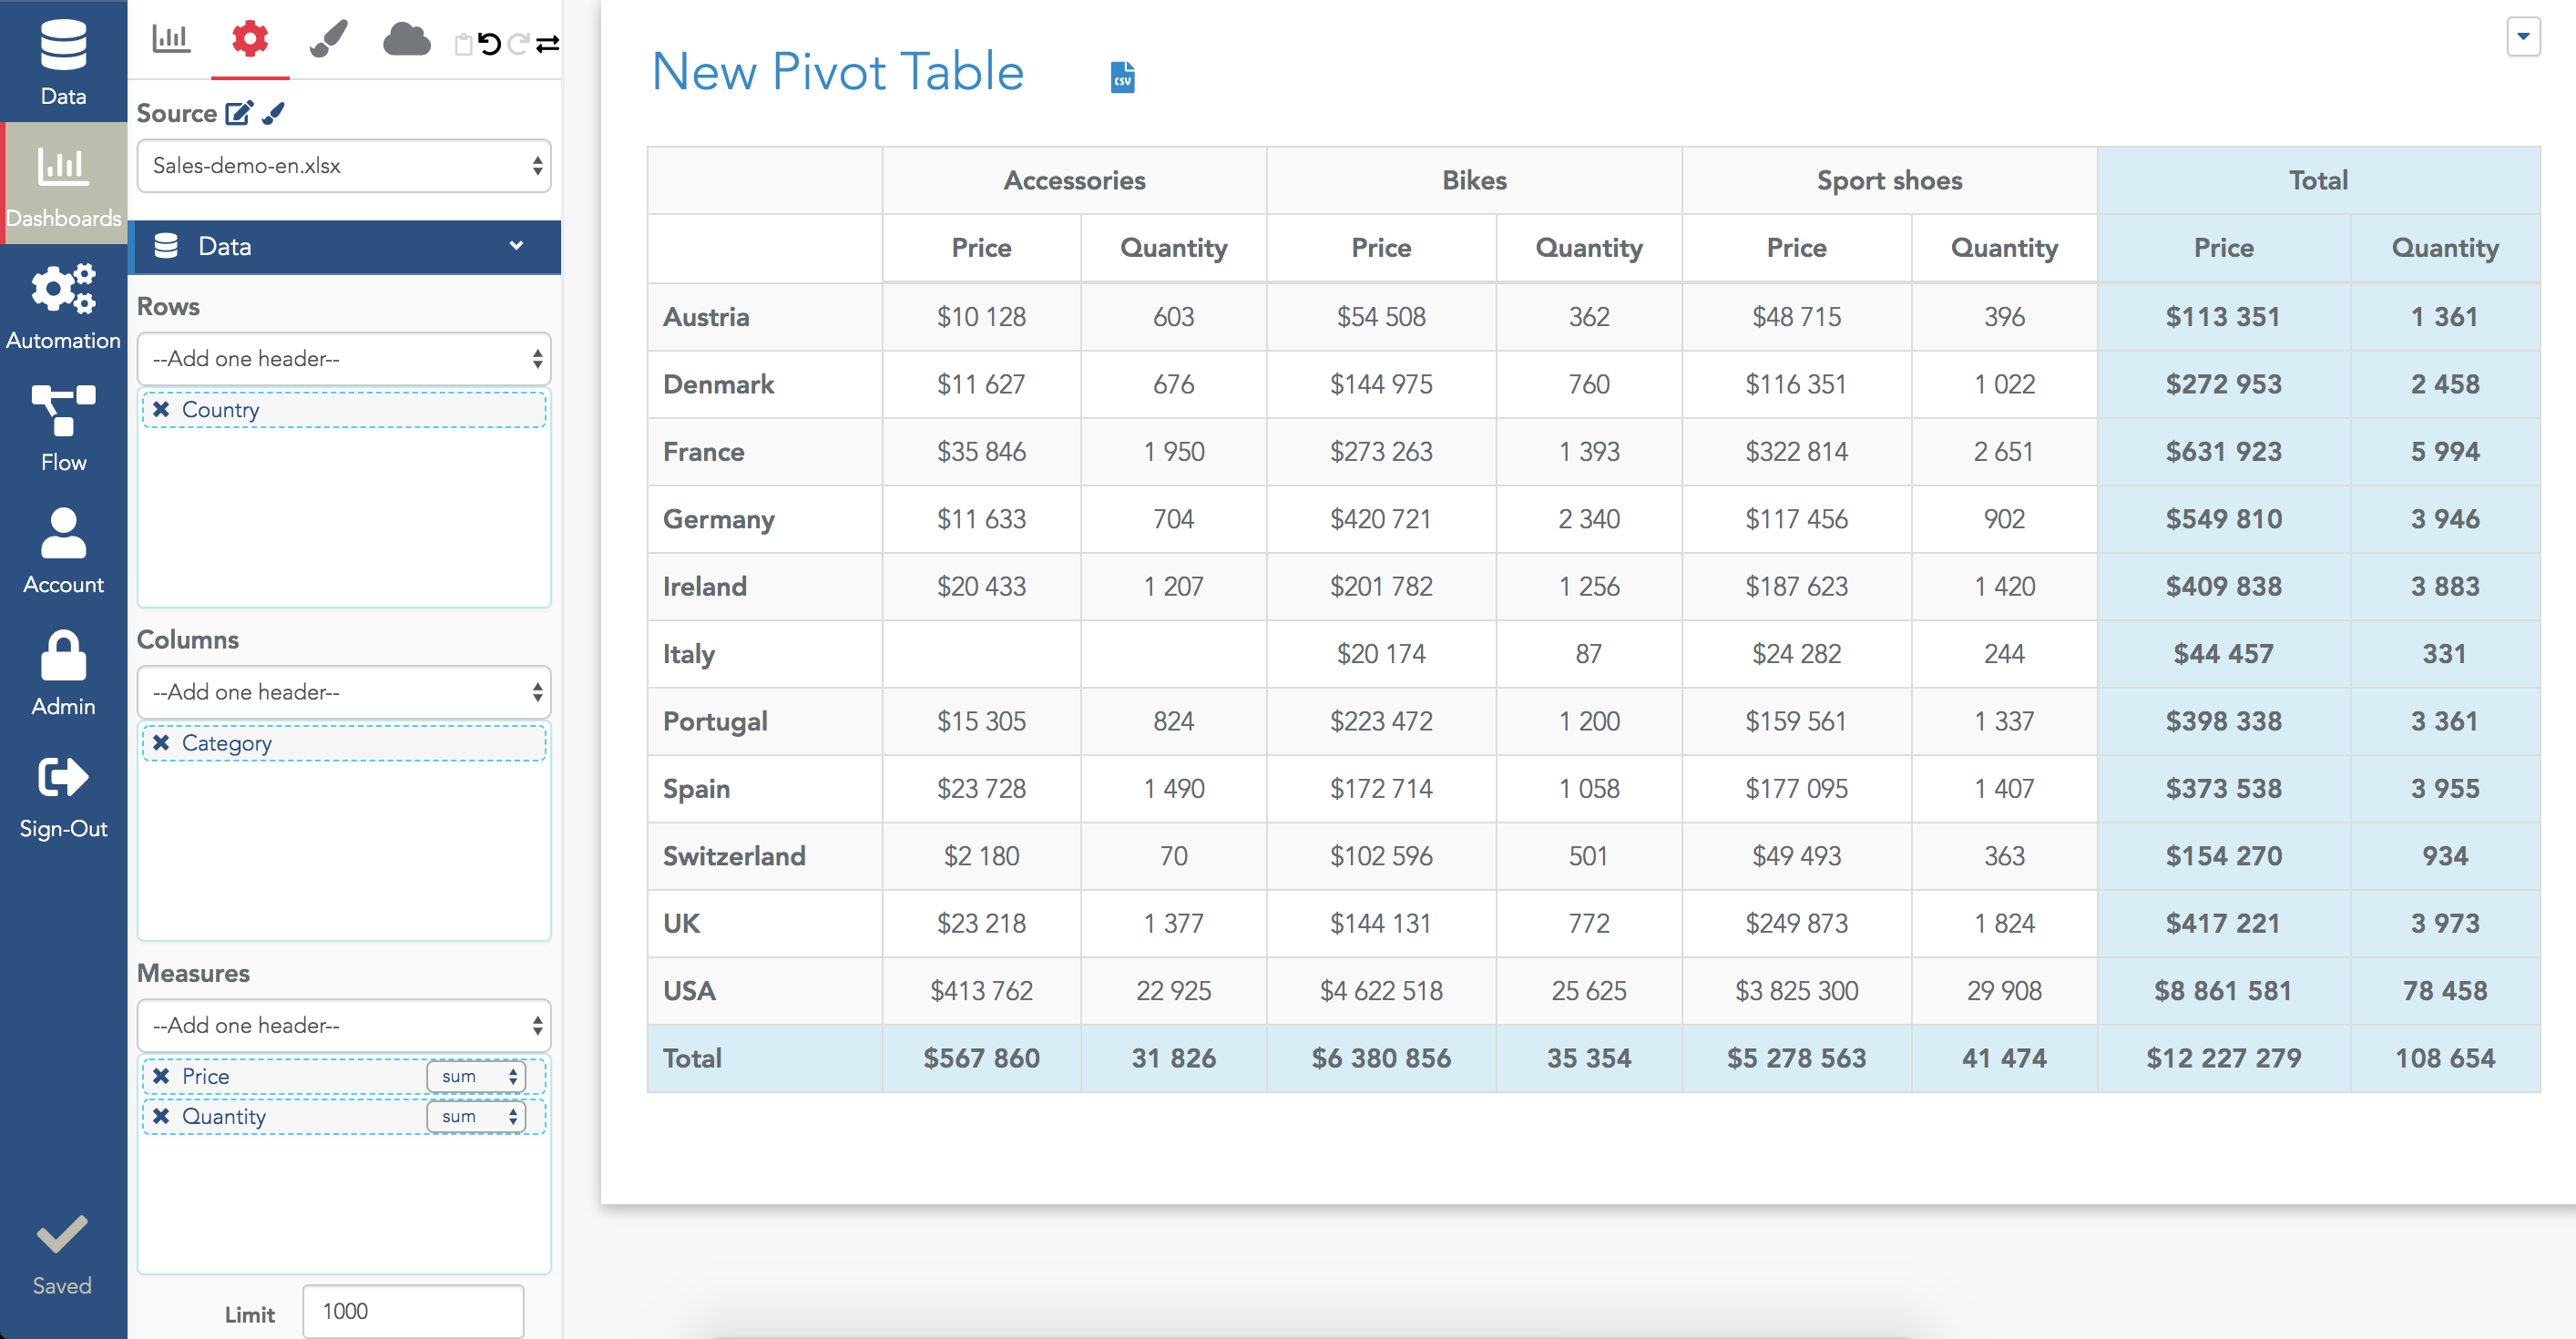
Pivot table with two measures
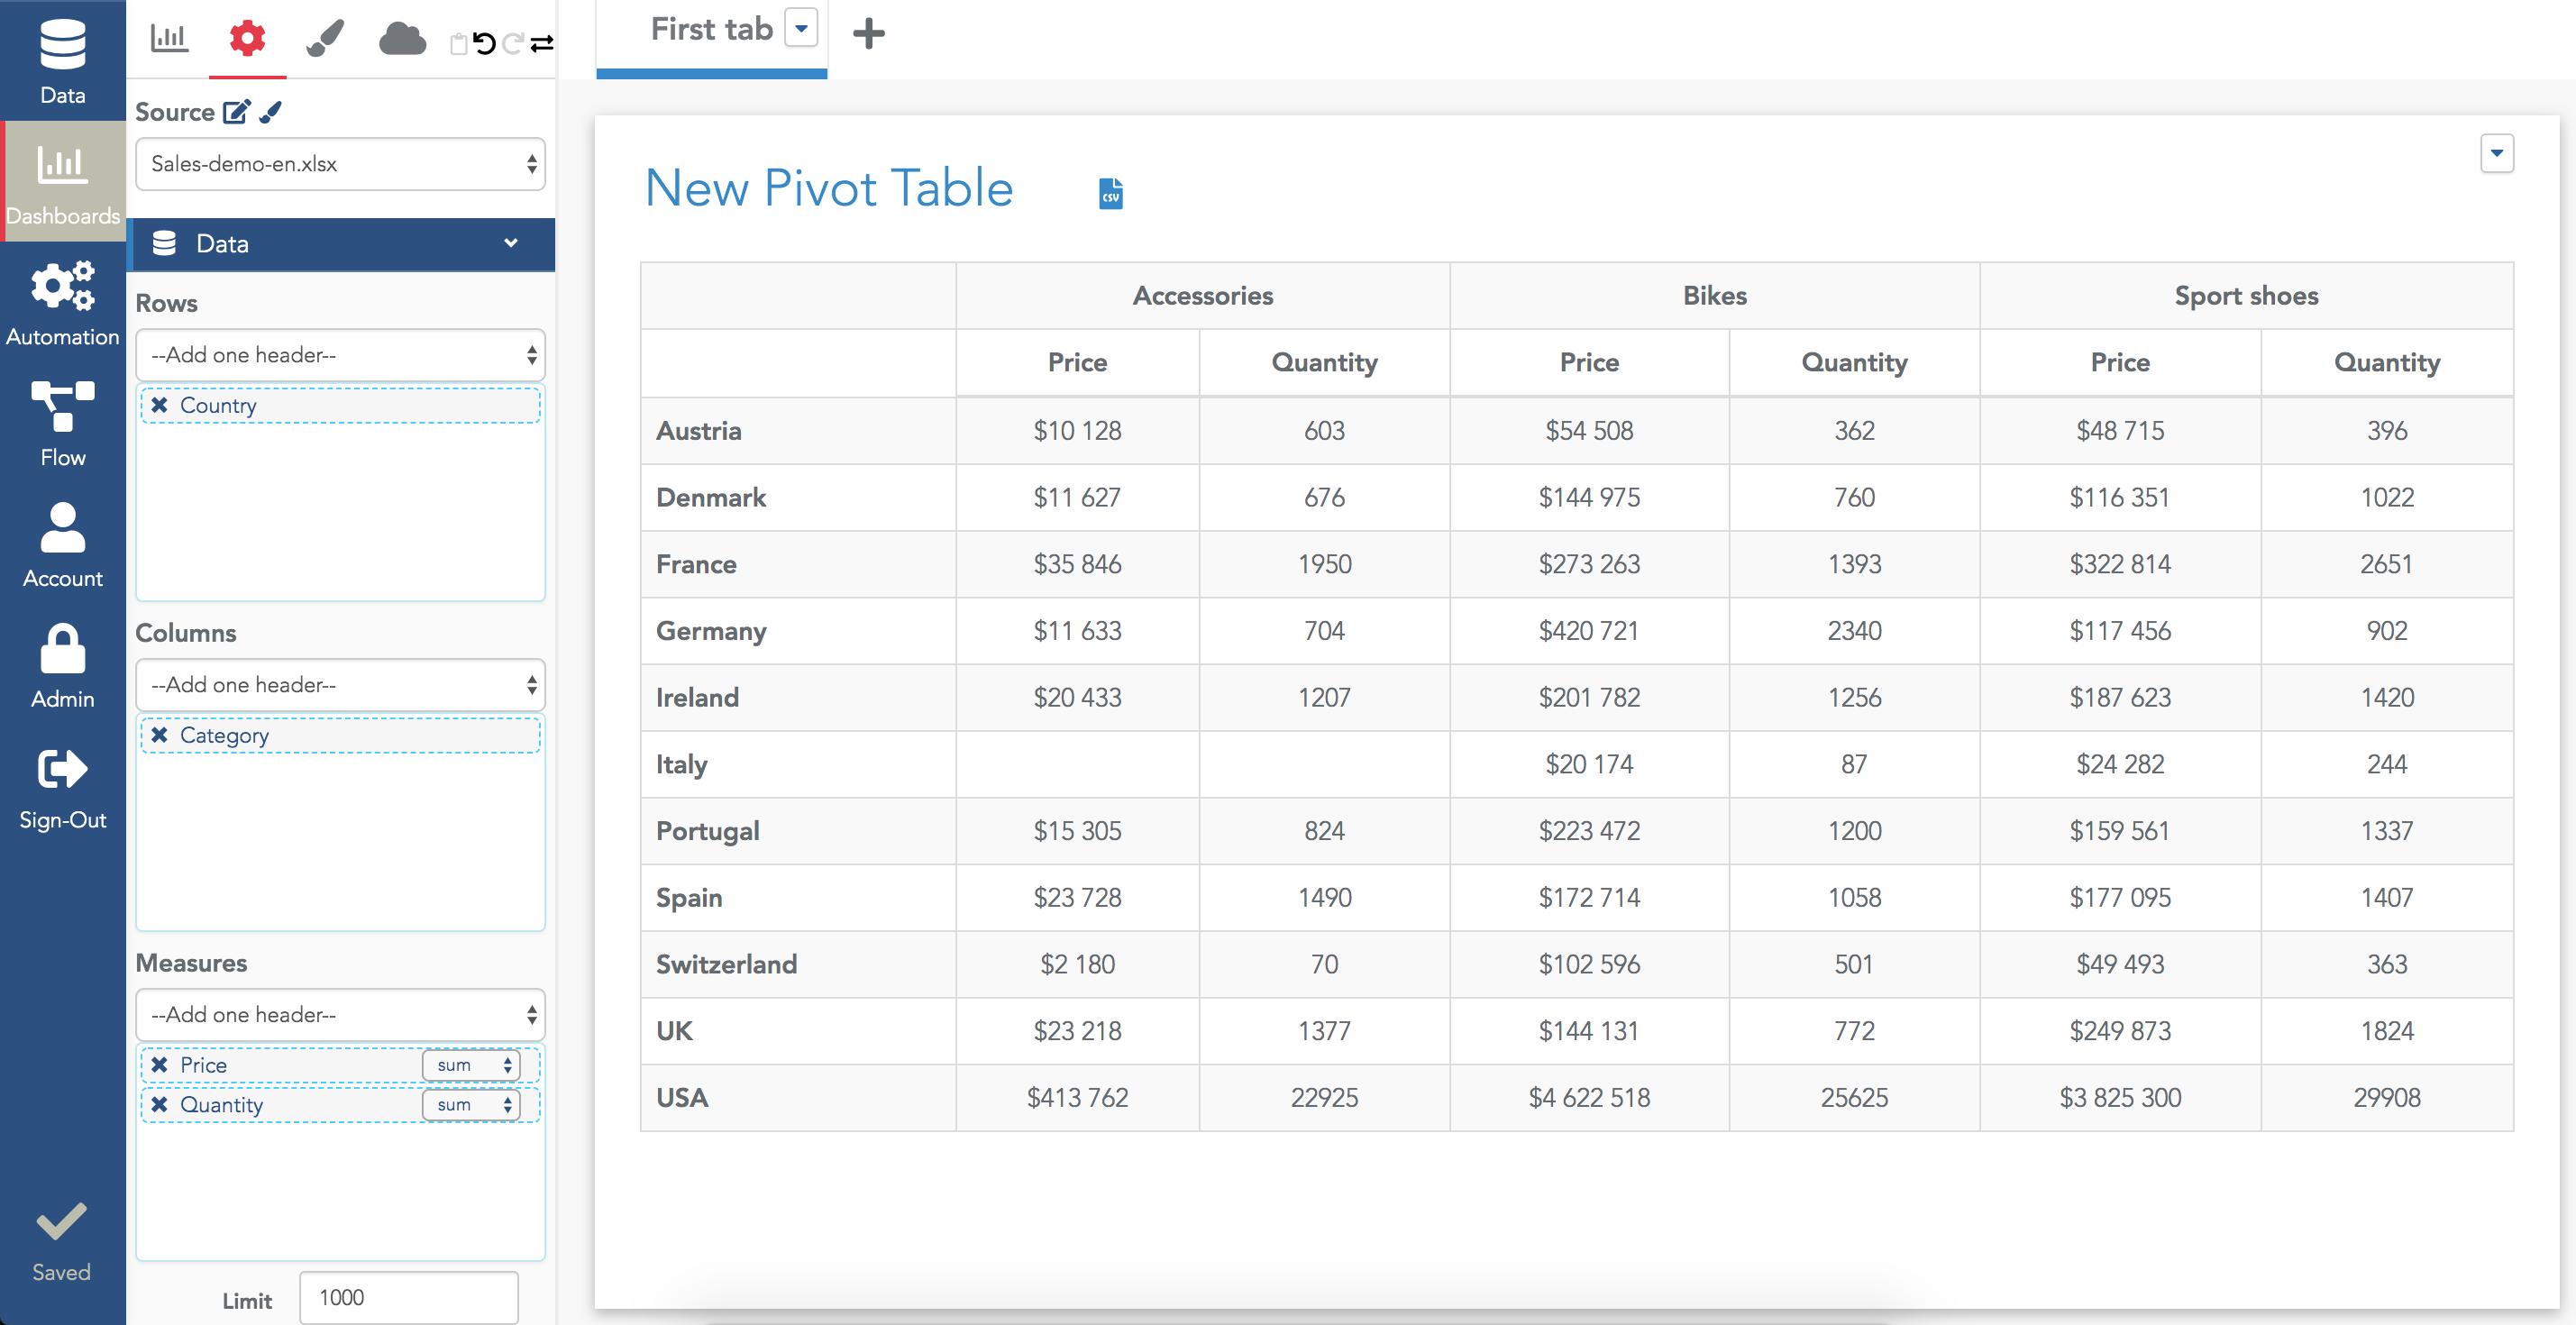
You can select several measures, they will be added as new columns. For example, the pivot table below show the measures sum(Price) and sum(Quantity):
Pivot table with n dimensions
You can also select as many dimensions as you need in rows and columns:
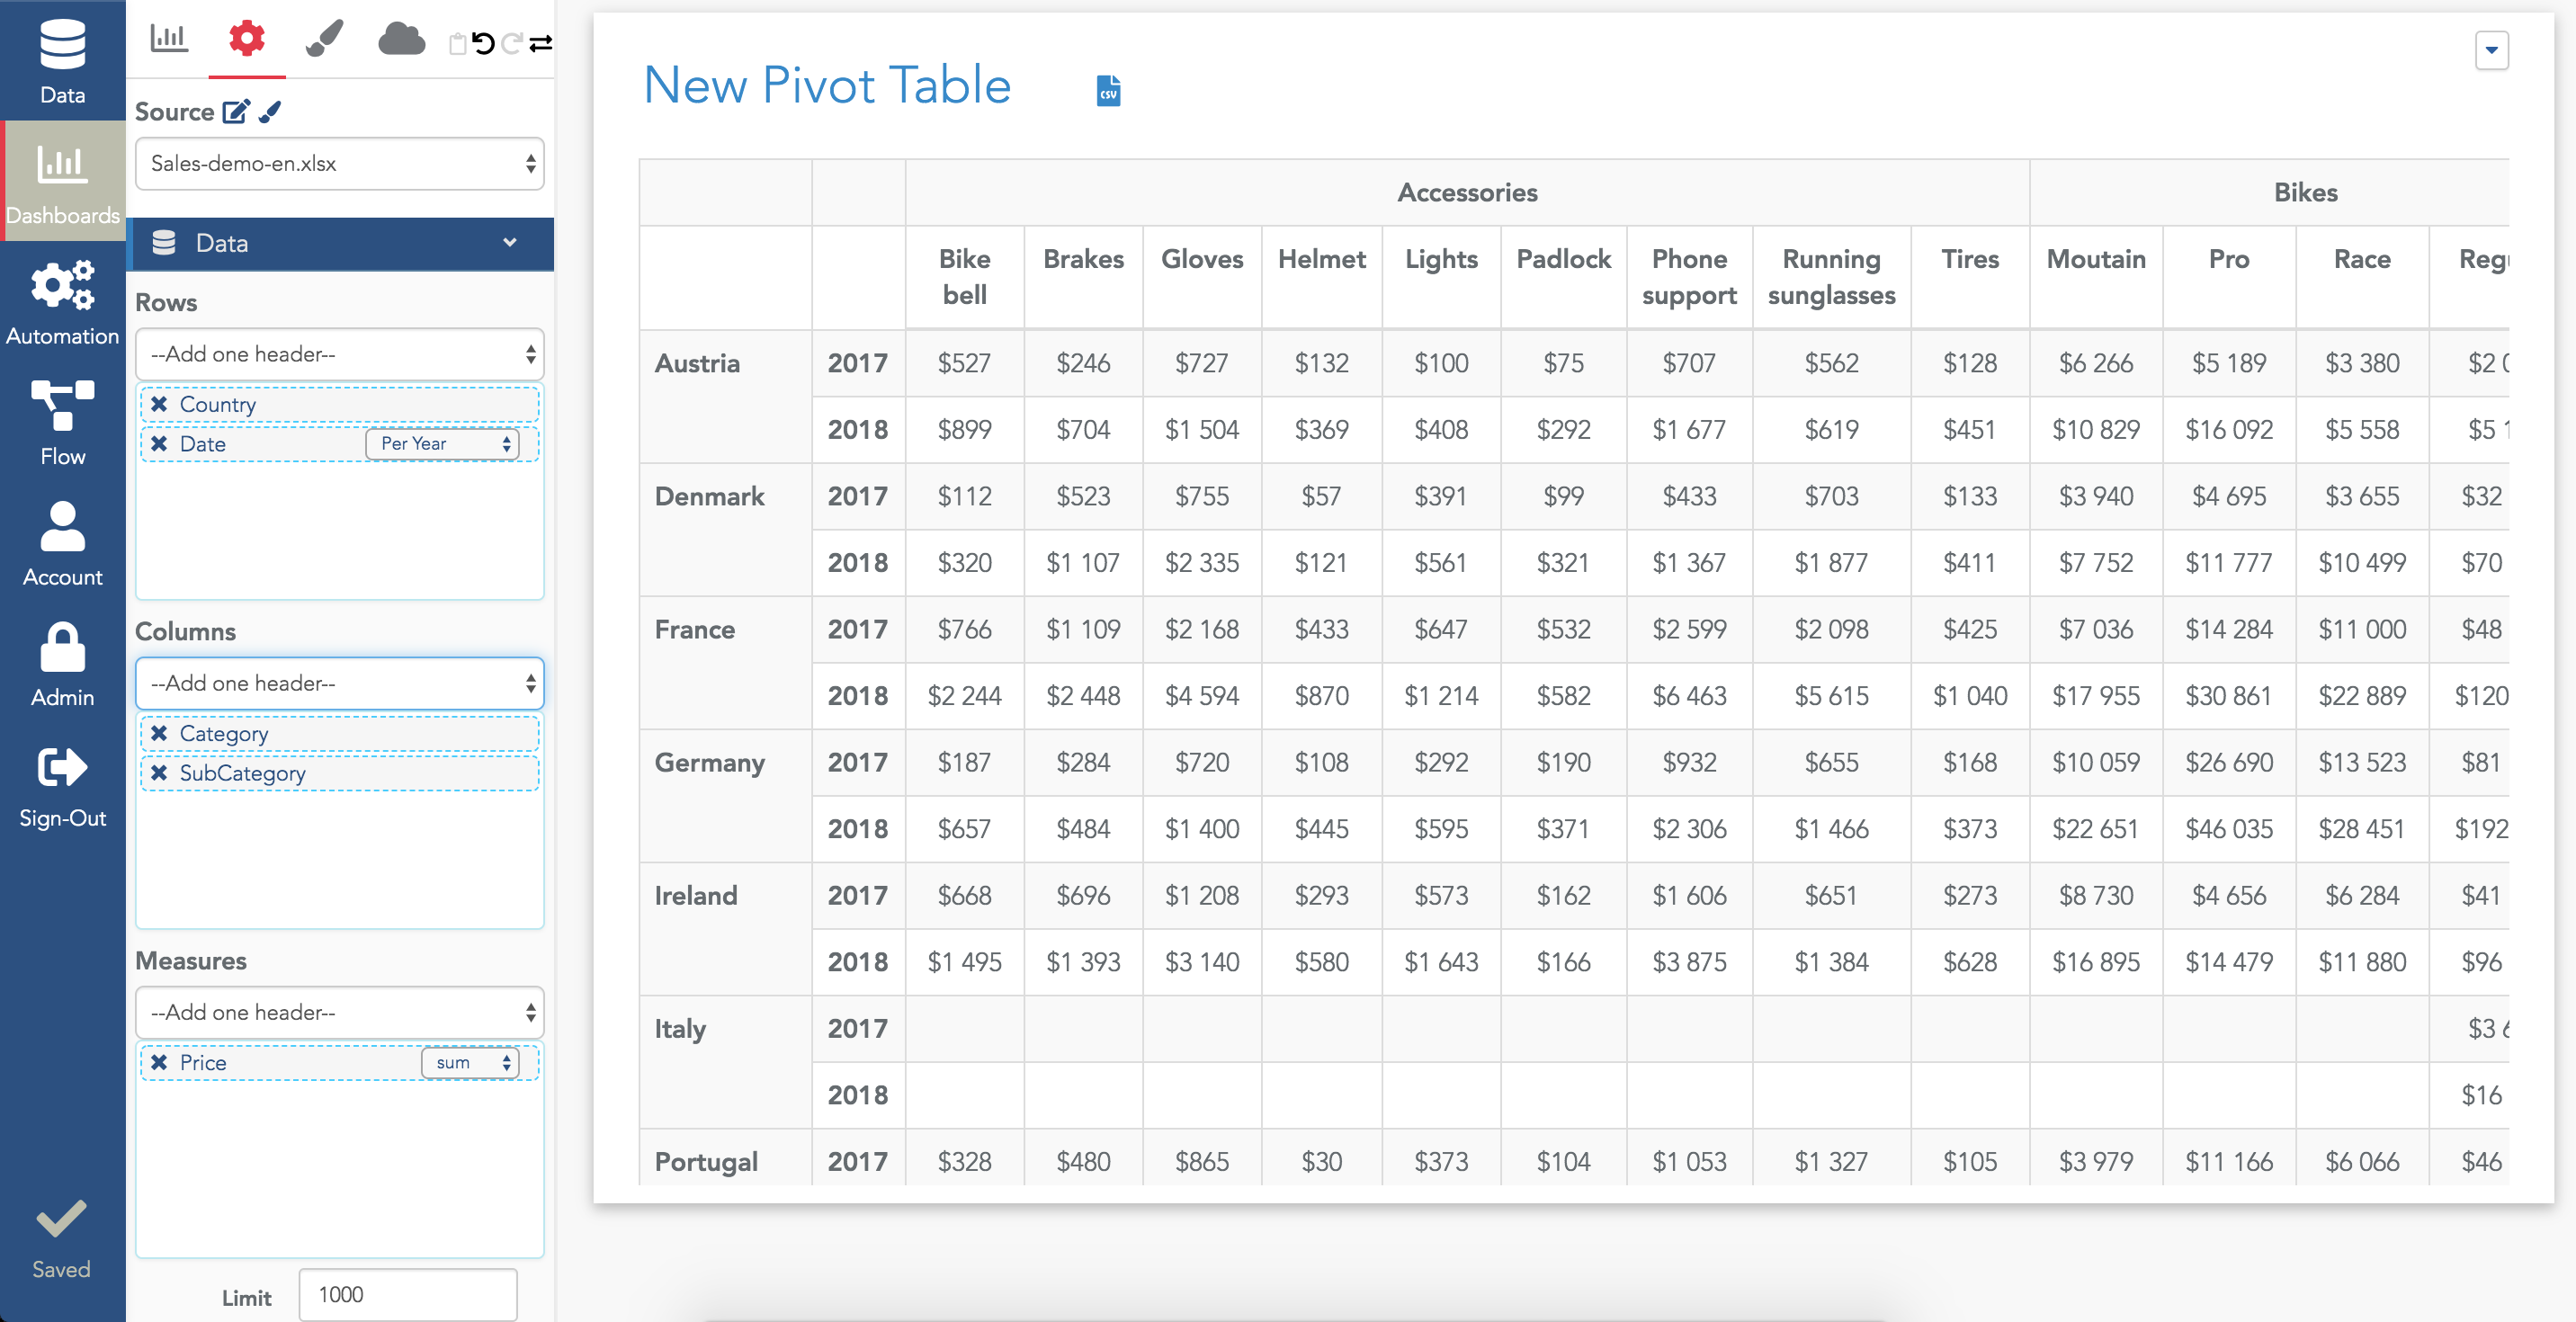
Warning: for a pivot table, the "limit" field is the limit of cells of the table. The default is 1000. If you select many dimensions, keep in mind to increase this limit (using the limit field below in the configuration).
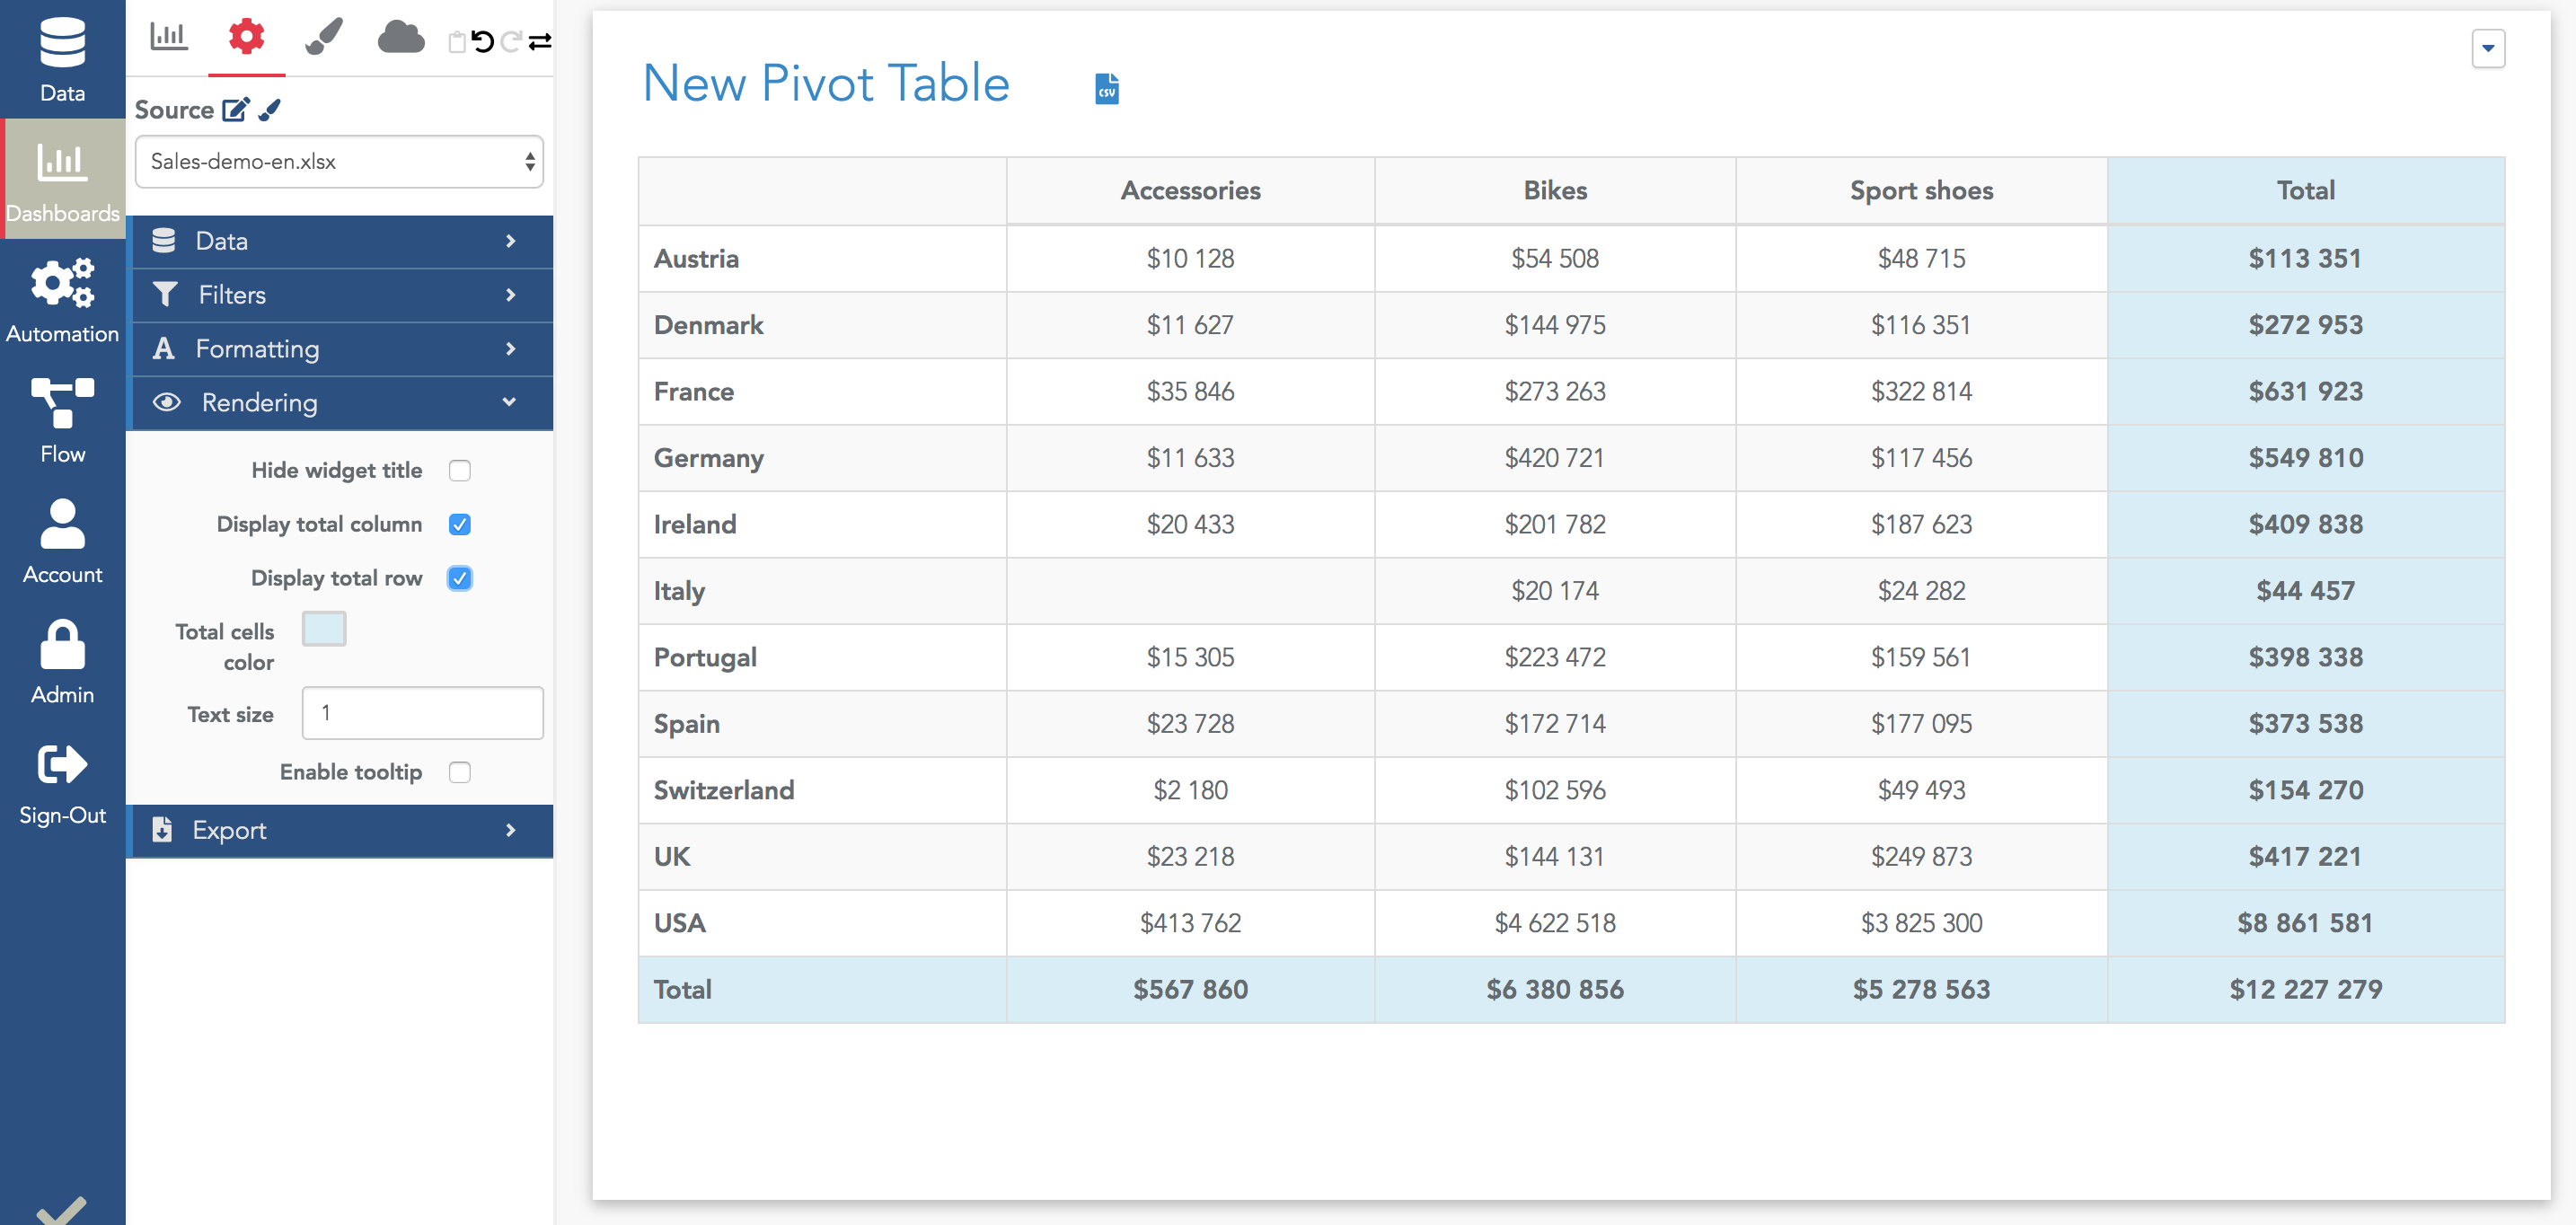
Show totals
To show totals, open the Rendering section of the widget configuration and enable "Display total row" and "Display total column":
Note that if you have several measures in your configuration, you will get several total columns on the right of your table:
×![]()