Open a second dashboard with details when an item from a first dashboard is clicked

Let's say you have a dashboard showing a list of purchases (e.g. the last 100 purchases from your website), and when a user clicks on a particular purchase, you want to open a new dashboard with details about the customer who did this purchase (her/his list of purchases, purchases frequency, favorite brands, etc).
This tutorial will guide you to create such a pair of dashboards (purchases list and customer details). But of course, you can adapt it to your needs for any type of data.
To be able to link a global dashboard and a detailed one, you need a common identifier. For example, in our purchases/customers example, the common identifier is the customer identifier. The columns' names can be different among datasources, but you need a way to know how to filter the detailed dashboard.
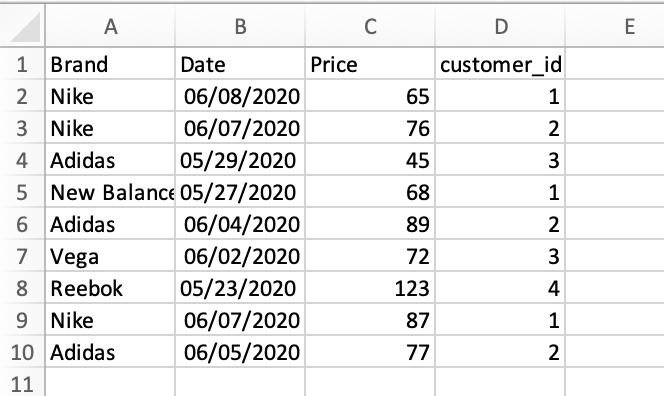
For this tutorial, we have a first file sales_data.xls with one row per purchase and a customer_id column (the identifier of the customer who did the purchase):
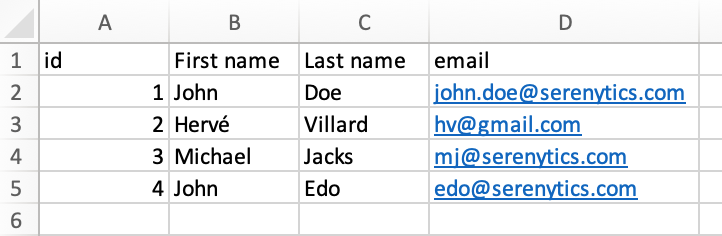
And we have a customers.xlsx file with one row per customer and an id column that contains the customer identifier:
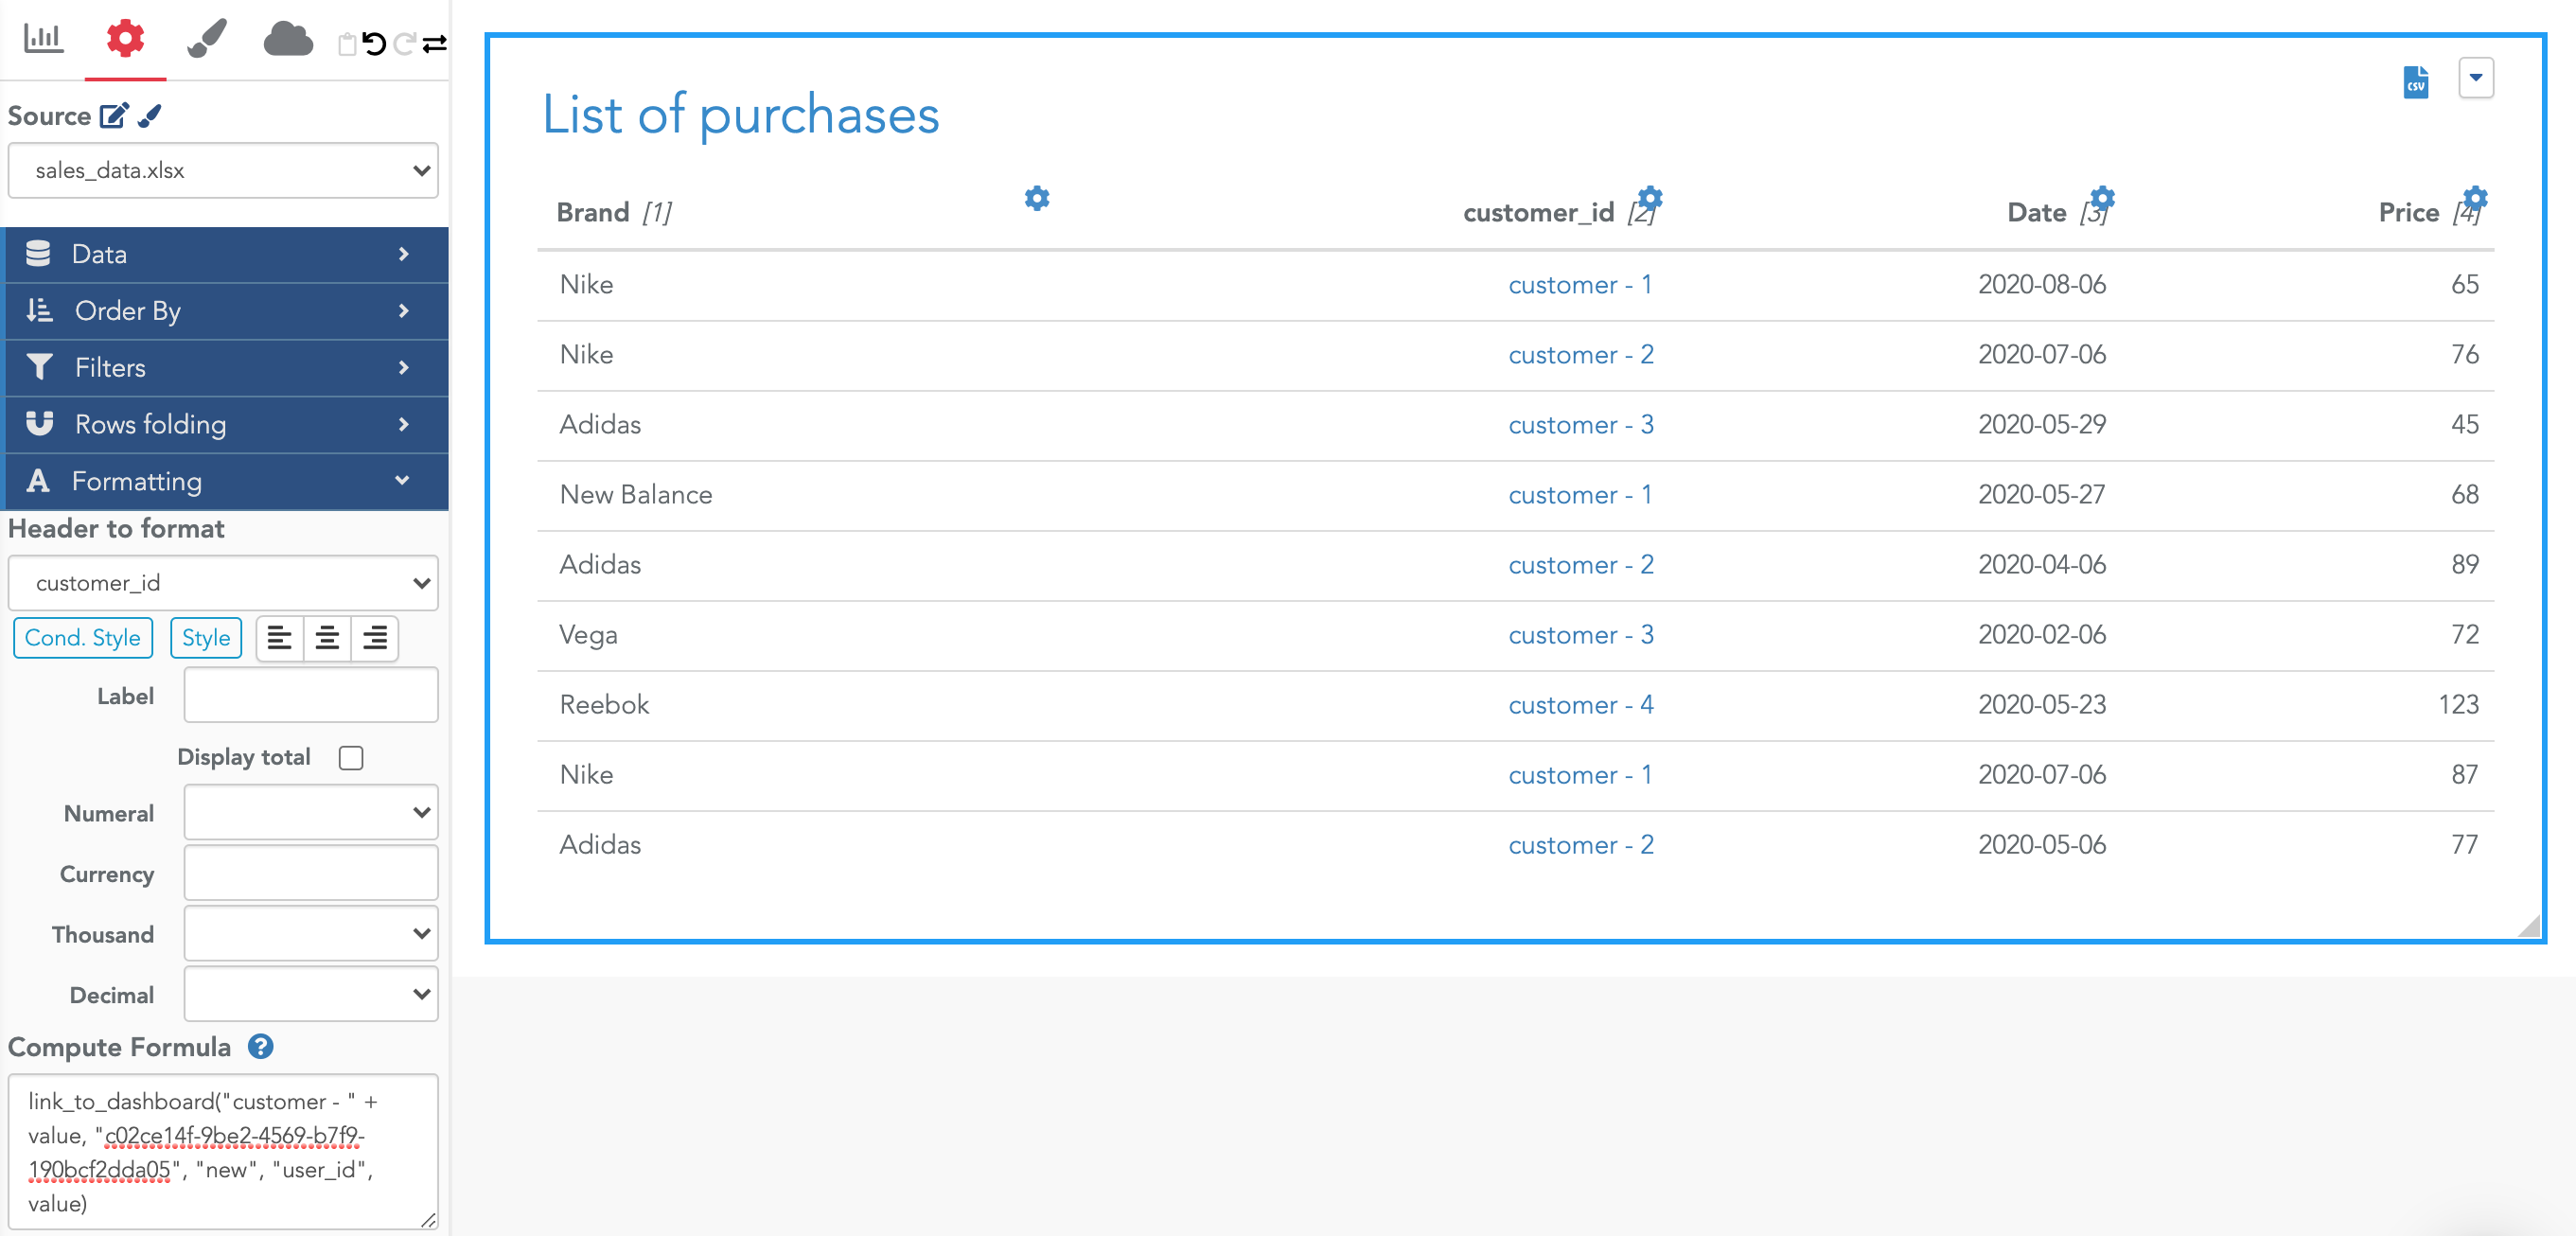
As a very first step, create a table in the main dashboard that displays one row per purchase (using the datasource that contains one row per purchase).
To create a link to the second dashboard, open the formatting options of the customer_id column. In this column, you need to use the formula link_to_dashboard to specify that a click on its content must trigger another dashboard:
The full documentation of this function is here.
You can use this function to create a fixed link to another dashboard. For example, if you use link_to_dashboard("my link", "c02ce14f-9be2-4569-b7f9-190bcf2dda05"), when the viewer clicks on "my link", it will open the second dashboard (the one with uuid "c02ce14f-9be2-4569-b7f9-190bcf2dda05") in a new window.
Note: the dashboard uuid (i.e. unique identifier) is the number that appears in a dashboard URL when you open it. For example, for the dashboard url "https://app.serenytics.com/studio/webapps/c02ce14f-9be2-4569-b7f9-190bcf2dda05", the dashboard uuid is: "c02ce14f-9be2-4569-b7f9-190bcf2dda05".
In our example, we use the formatting formula link_to_dashboard("customer - " + value, "c02ce14f-9be2-4569-b7f9-190bcf2dda05", "new", "user_id", value):
Here is an explanation for each parameter:
- Param 1 - "customer - " + value: specifies the displayed link to look like "customer - 1"
- Param 2 - "c02ce14f-9be2-4569-b7f9-190bcf2dda05": the uuid of the dashboard to open
- Param 3 - "new": specifies that the dashboard will be opened in a new browser tab.
- Param 4 - "user_id": specifies to the function that a parameter named "user_id" will be passed to the second dashboard.
- Param 5 - value: this is the value for the parameter specified in param4. You could also have picked another value from the row (using line[3] for example).
In this second dashboard, we want to display the list of purchases for the user clicked by the viewer in the first dashboard.
First, let's create a new dashboard with a purchases table and some global KPIs:
- The min of the column FirstName of the datasource customers.xlsx
- The sum of the column Price of the datasource sales_data.xlsx
- The min of the column date of the datasource sales_data.xlsx
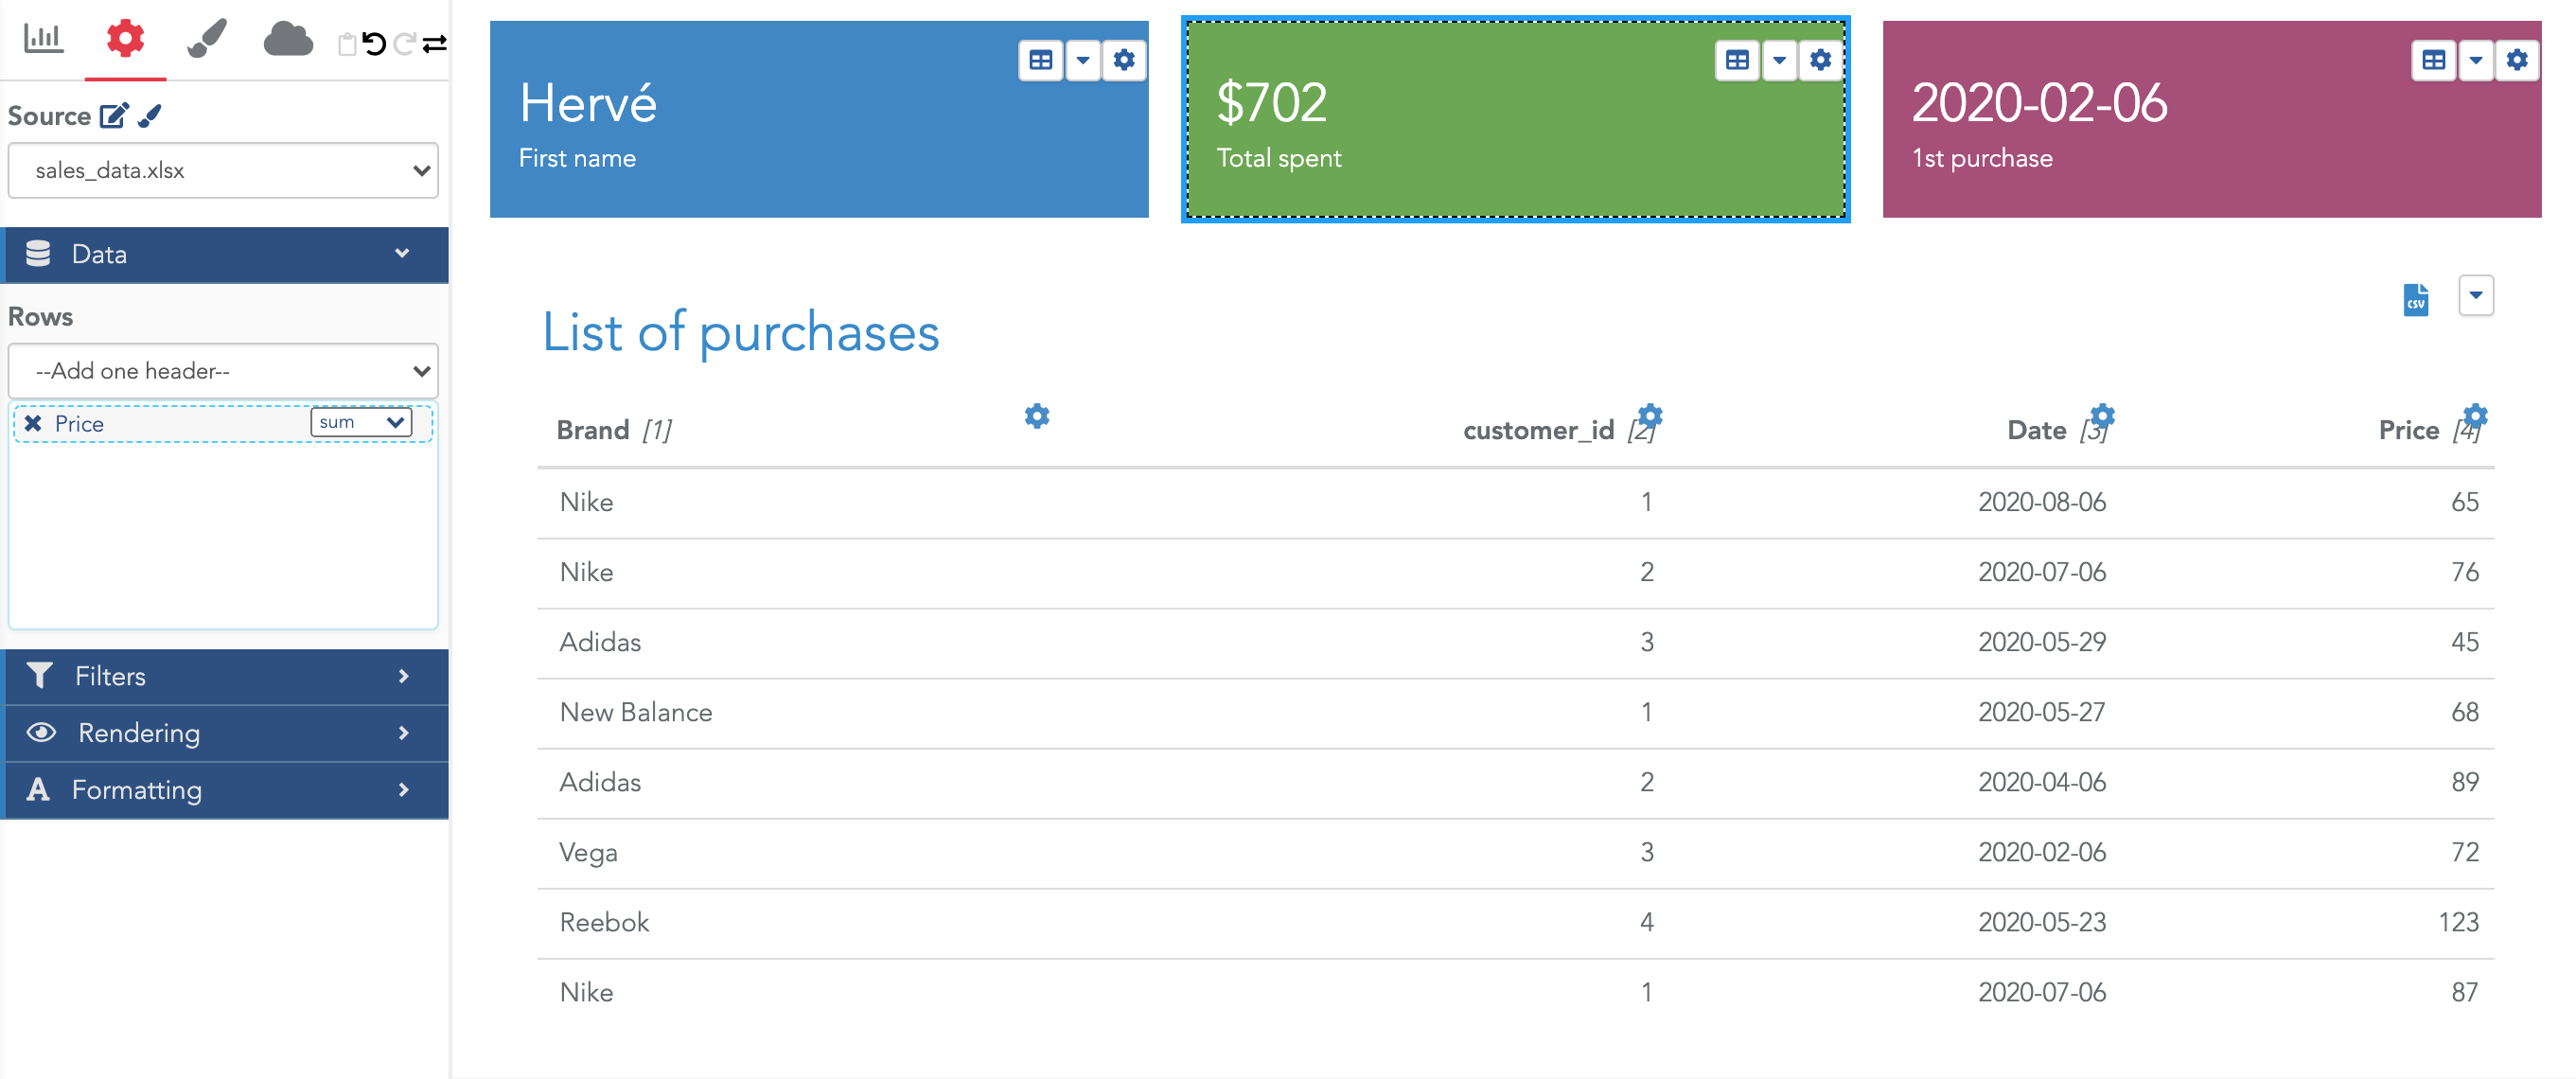
So far, in this dashboard, $702 is the total sum of the column Price, for all customers.
To filter this dashboard for a single customer, open the global properties tab and open the global filters section. Then select the datasource sales_data.xlsx and specify the filter customer_id == {{user_id}}:
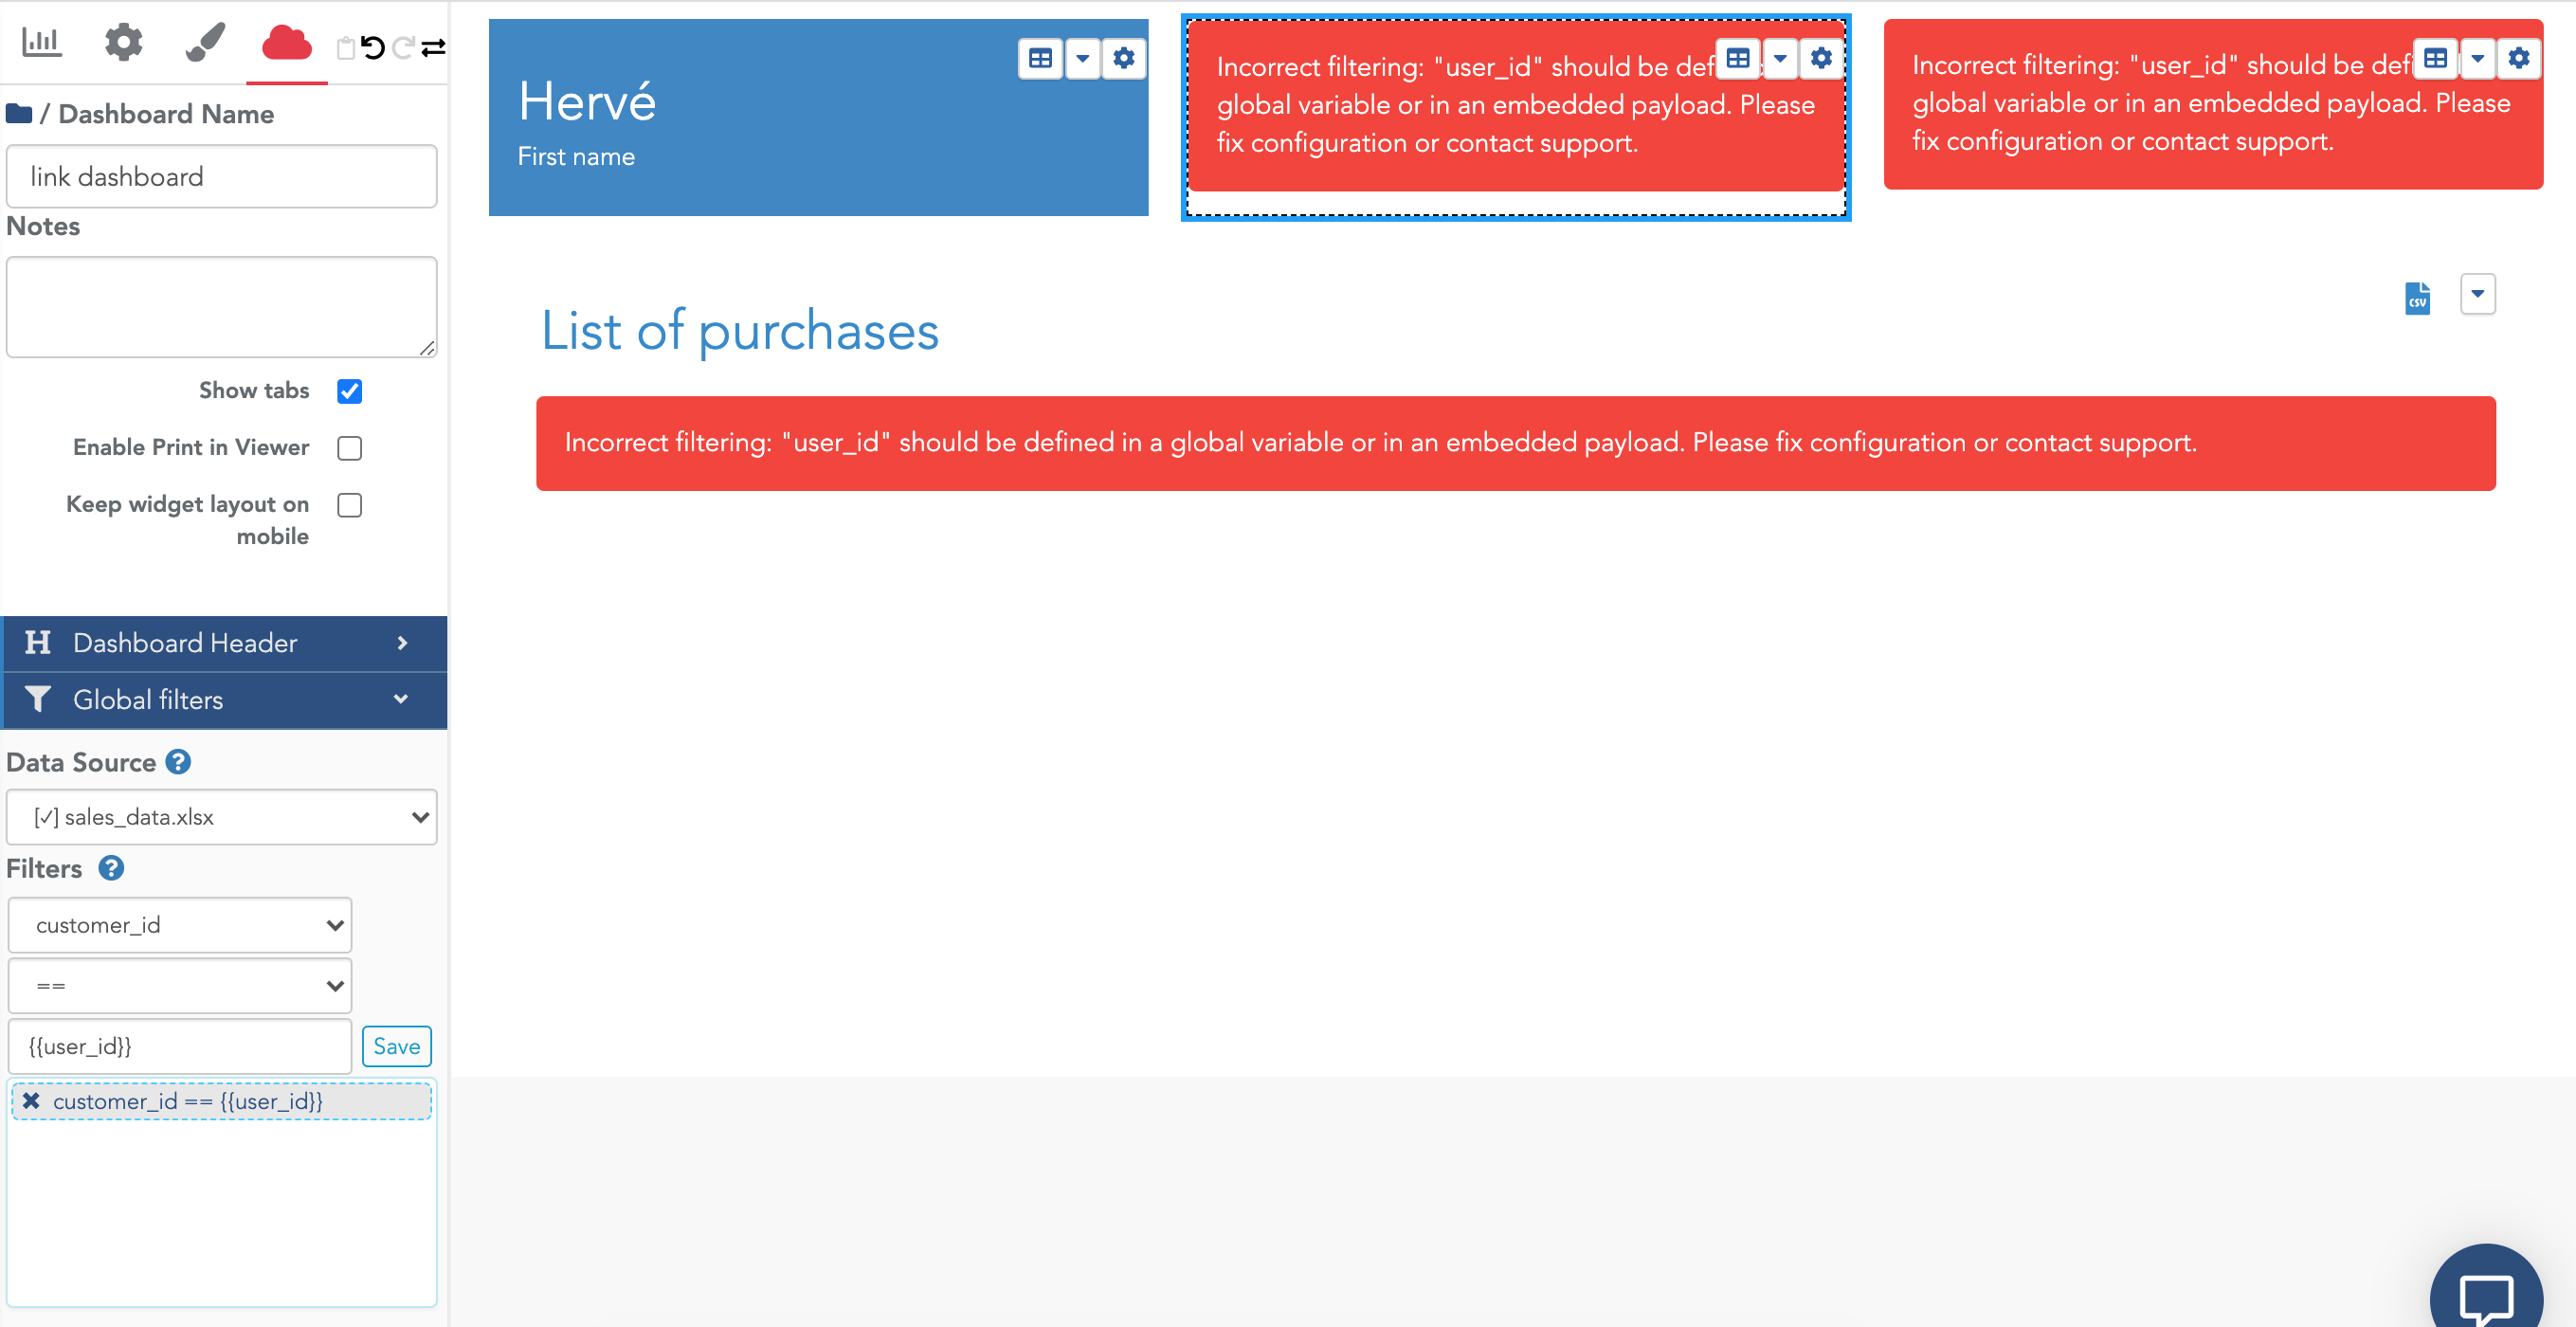
The syntax customer_id == {{user_id}} specifies that in this dashboard, the datasource sales_data.xlsx will be filtered to keep only rows where column customer_id equals the value of a variable named user_id. But so far, this variable is not filled with a value, and thus, the dashboard shows errors.
Note that because the widget showing the customer first name uses the customers.xlsx datasource, and we didn't specify that this datasource is filtered by a variable, it doesn't show an error. Of course, we must add a second global filter to specify that this customers.xlsx datasource must also be filtered by id == {{user_id}}. We use id as this datasource contains the customer identifier in a column named id.
Then, there are two ways to pass the value of this variable user_id:
- Option 1: The value can be passed as a test value in the studio to check that our dashboard is correct (and to remove the ugly error messages).
- Option 2: When a viewer opens this dashboard by clicking in another dashboard in a table where the function link_to_dashboard has specified this value (like in our example above).
For the option 1, open the section Test Payload and enter the variable value in a JSON format: {"user_id": 1}
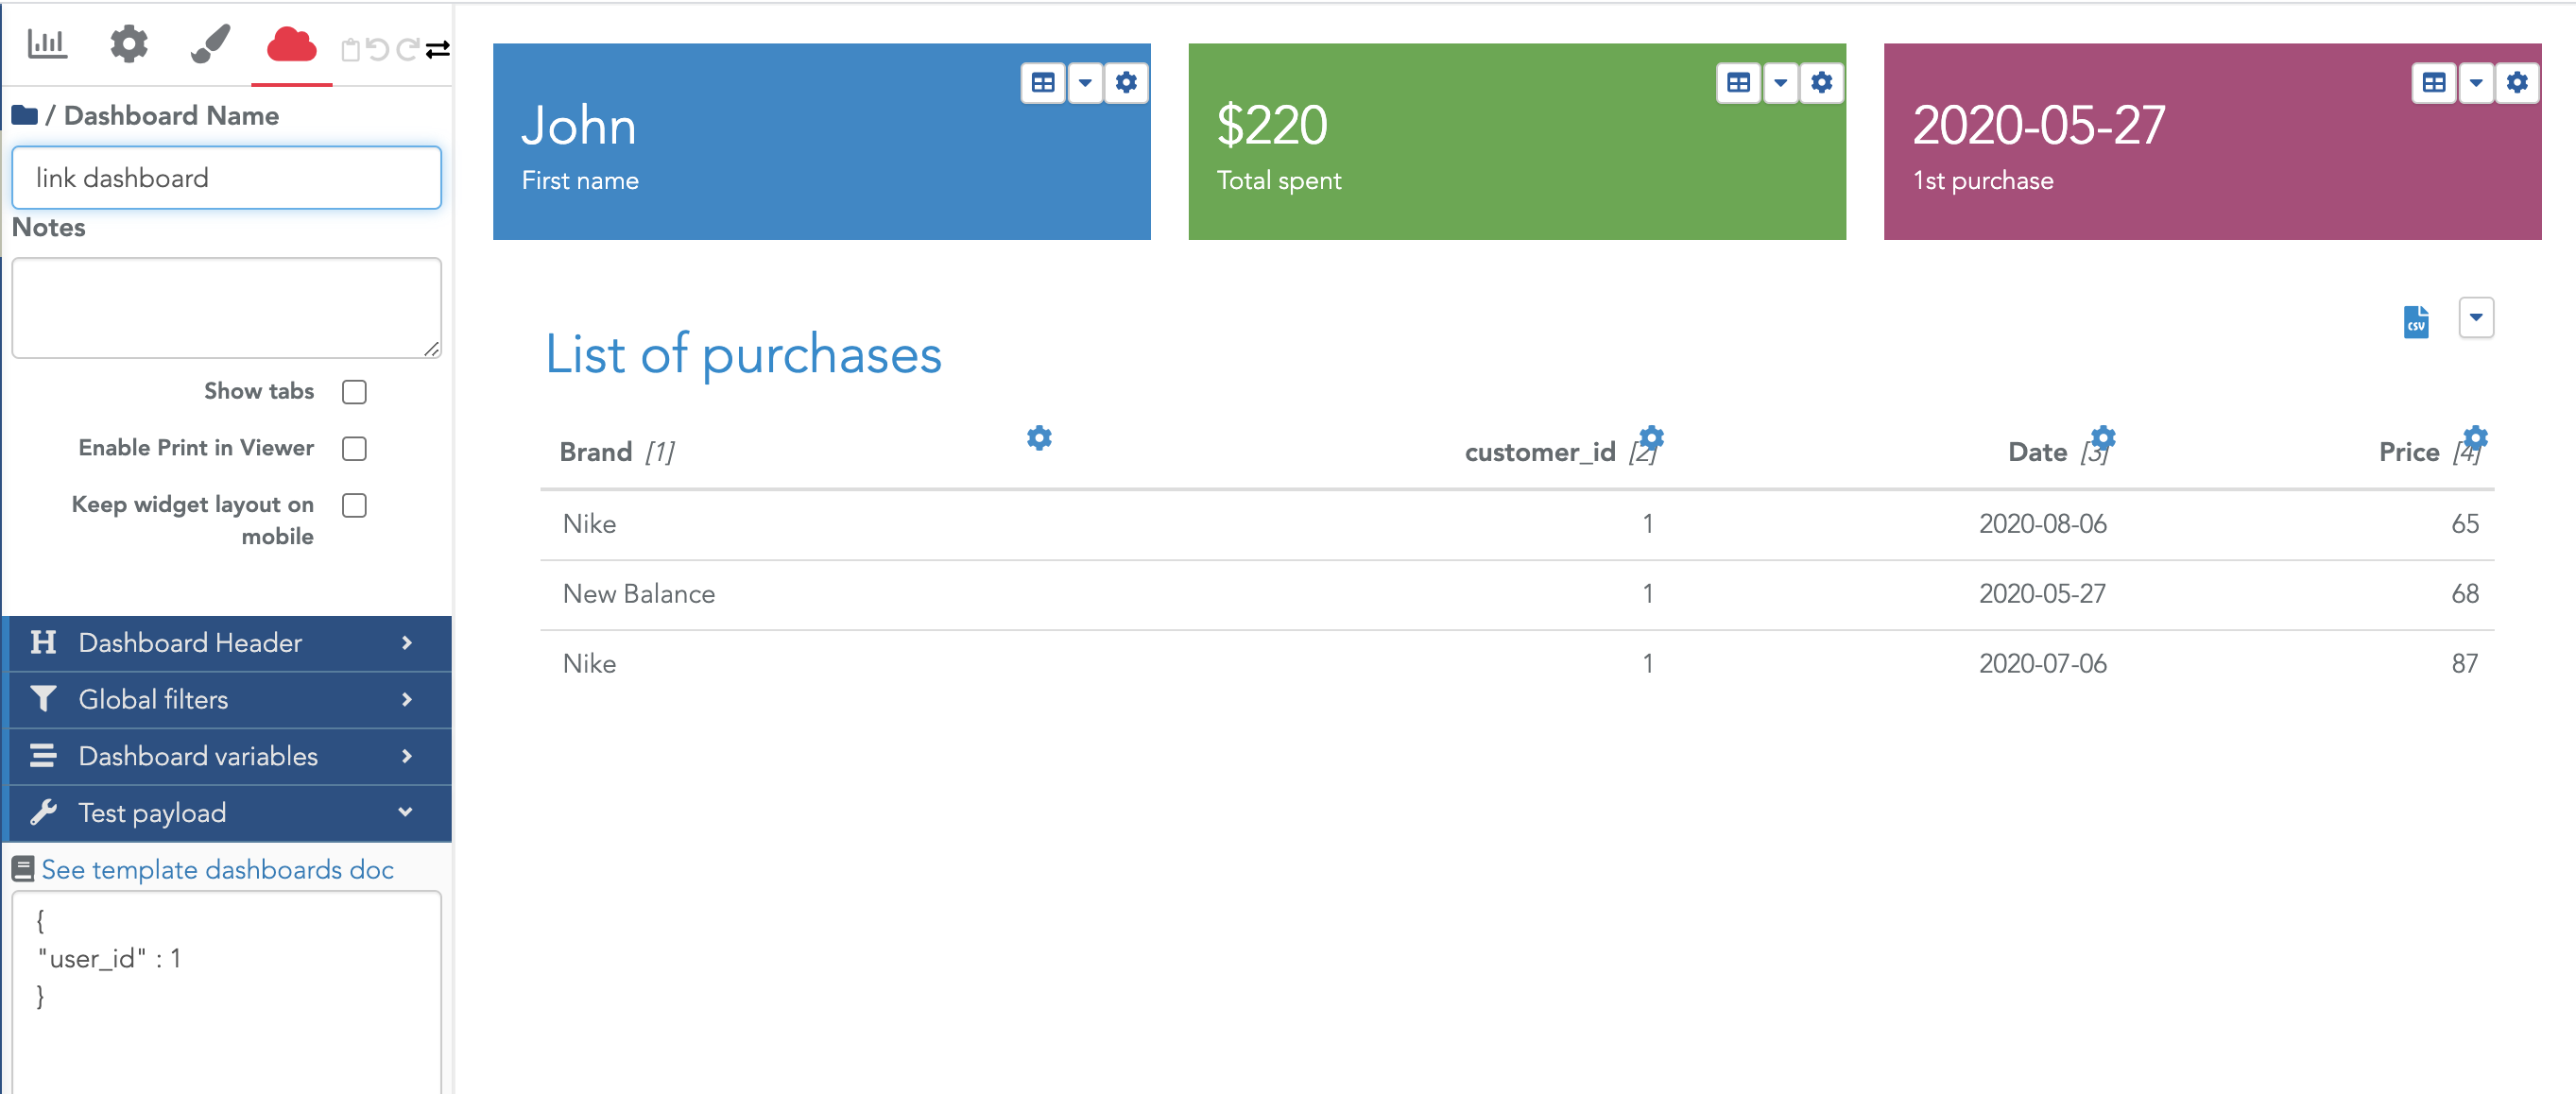
This option lets you test your filtered dashboard with a given parameter value.
For option 2, everything was already configured in the global dashboard by using the formatting function: link_to_dashboard("customer - " + value, "c02ce14f-9be2-4569-b7f9-190bcf2dda05", "new", "user_id", value).
You can now open this first dashboard created at the beginning of this tutorial and click on the customer-X links, and the second dashboard will pop up with the correct filter.
In the sharings dialog, you need to share both the main dashboard and the detailed one to viewers. If you don't share the detailed one, the viewers will be able to open the main dashboard, to click on the links but it won't open the detailed dashboard (access will be refused).
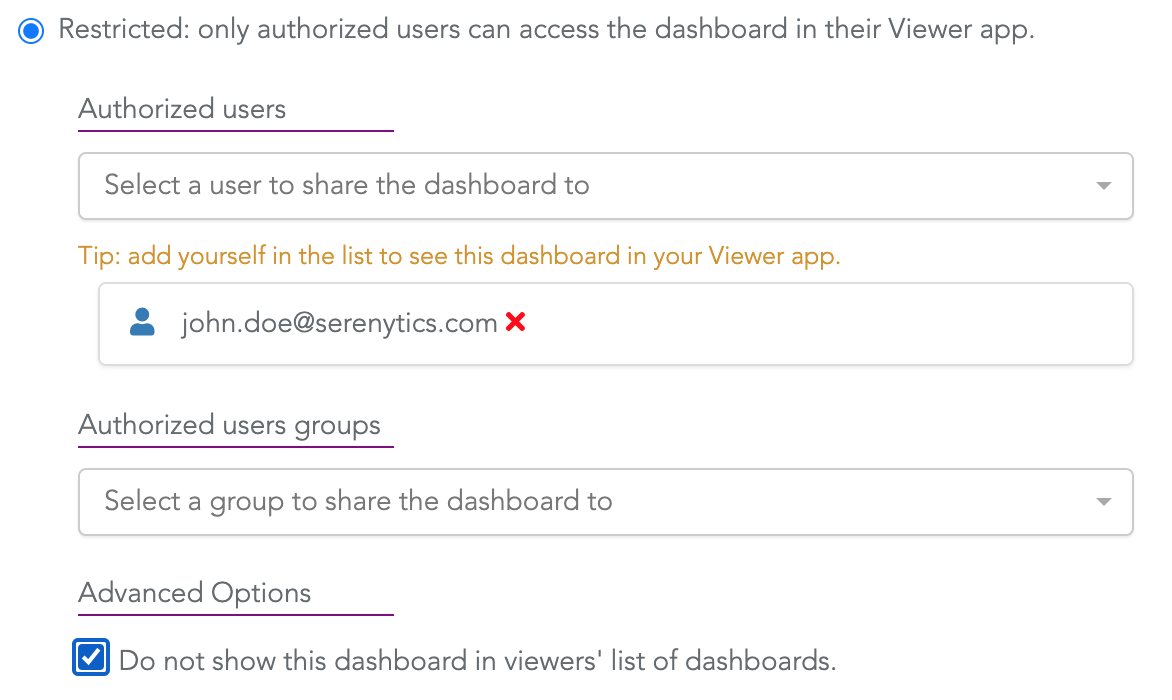
With this sharings configuration, when a viewer signs in, she/he sees both dashboards in her/his list of dashboards (the main one and the detailed one). That's an issue because if he clicks directly on the detailed one, the dashboard will show errors as the dynamic filter value is not defined.
The solution to this issue is to hide the detailed dashboard from the viewer's list of dashboards using the option "Do not show this dashboard in viewers' list of dashboards":
In the global dashboard, it happens often to have a column customer_name and another column customer_id which is a technical id. In this case, we want the customer name to be the clickable column, it must pass the value customer_id to the second dashboard, but this customer_id column must not be visible to the viewer.
To do that, use the function below to format the column customer_name (let's say the column customer_id is the fifth table column): link_to_dashboard(value, "c02ce14f-9be2-4569-b7f9-190bcf2dda05", "new", "user_id", line[5]):
Then, to hide the column customer_id in this table, open the formatting option of this column:
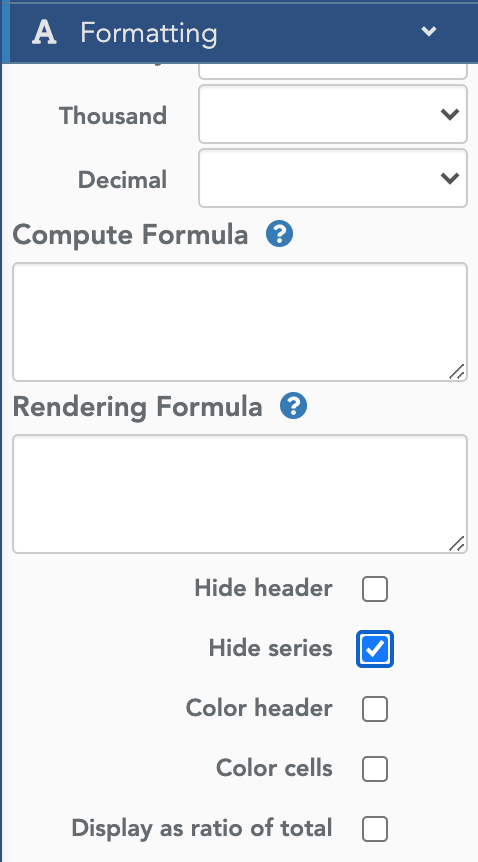
This column is still available to the formula engine, but is hidden to the viewer.
And that's all for this tutorial. It opens a way to create advanced reporting applications.