Create a free-table based on several datasources

In many cases, you want to compute KPIs between other KPIs coming from several datasources. For example, let's say you have :
- A datasource with the number of visitors on your website (e.g. Google Analytics)
- A datasource with the purchases on your website (your sales backend)
- A datasource with your total Ads budget (an XLS file)
And you want to generate the KPI table below:
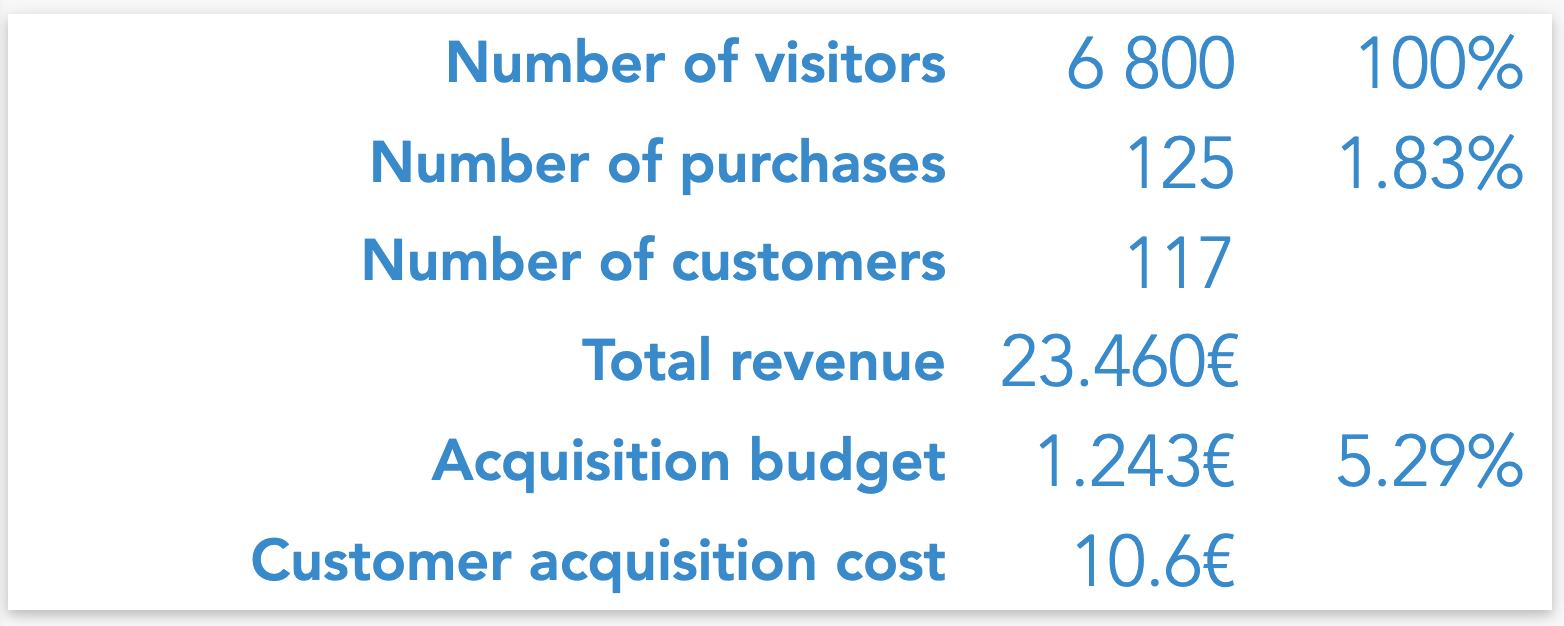
To create such a table, one option is to create a dataflow to create a single data table (a large join) that will gather all the data from these datasources. But this is usually very complicated or even impossible to achieve. Instead, you can use a widget called free-table to get data from several datasources and compute formulas between the results.
In Serenytics, a free-table is a table where each cell can be either:
- A value computed from one datasource (each cell can query data from a different datasource)
- A simple text
- A formula between other cells
This creates a 2x2 default custom table. You can add/remove columns or rows by clicking on the top-right icon of each cell.
When you select a cell (by clicking on it), in the settings menu, you can select its mode :
- Text: to display a simple text in the cell.
- Value: to query data from a datasource.
- Formula: to compute a formula between other cells.
Text cells are very easy to modify. You can click on the cell text to edit it directly on the table.
Value cells require you to select a datasource and the metric you want to query. It's very similar to a single KPI widget.
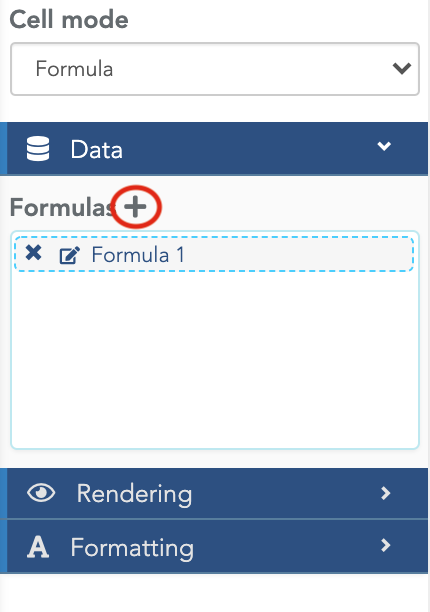
When you select Formula mode, the first step is to create the formula itself. To do that, you need to click on the "+" button (in the red circle in the screenshot below), in the Data menu:
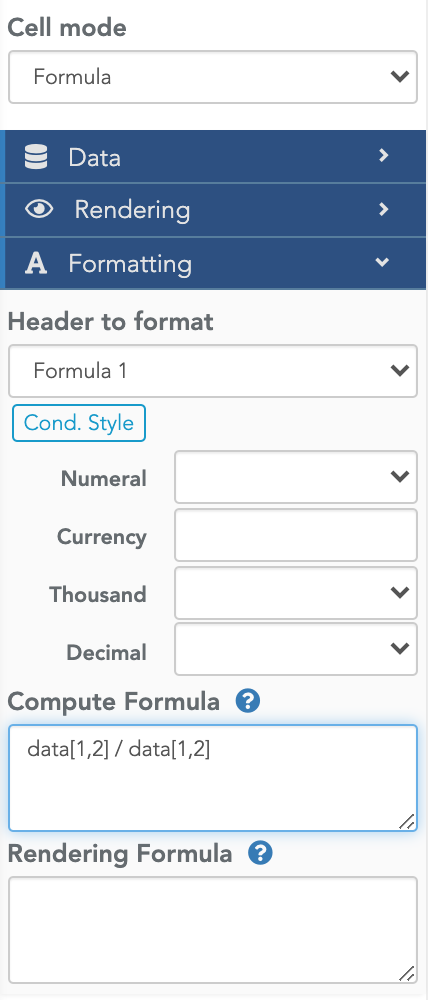
To edit your formula, open the Formatting menu, and select your formula in the "Header to format" selector. You can now edit the formula in the "Compute formula" section.
In this formula editor, you can access the result of other cells using the "data[row,column]" variable. For example:
- data[1,1] is the top-left cell
- data[1,2] is cell on the first row, second column
- data[3,2] is cell on the third row, second column
And of course, this is powerful because you can write multi-cell formulas such as data[1,2] / data[2,2]:
You can also use any formula from the documentation here.
Warning: the content of data[r,c] must be a number to be used in a computing formula. To convert a cell to a number, use the toNumber() function.
Tip: the data[r,c] variable is also available when a cell is in value mode. So it is possible to divide the result of a data query by the result of another cell without having to display the query result.
For some advanced computations, you need to query values from datasources but you don't want to show these values. You only need them to compute other KPIs. To do that, add an extra column in your free-table and configure cells in this column to query the data you need. This data is then available in the other cells by the variable data[r,c].
To hide this column, open the "Columns width" section in the "Free table global settings" and set to 0 the column width. It won't be visible to the viewer, but you will be able to access its cells' values.