
Use our free Plan to create a dashboard using your REST API
Sign-upOverview
Using Serenytics, it's very easy to create a dashboard based on data from your REST APIs.
Before we start, it's important to understand the two modes to use a REST API in Serenytics:- Live mode: whenever a viewer loads a dashboard, the data will be queried from the REST API in live. The main advantage of this mode is that any change on your data will be available immediately in the dashboard. The counterpart is that the dashboard might be slow if your API is slow.
- Synchronized mode: in this mode, the data from the API is synchronized on a regular basis into the Serenytics datawarehouse (e.g. every 5 minutes, every hour...). When a viewer displays a dashboard, the data is obtained from this datawarehouse. The main advantage of this mode is its speed. The counterpart is that the data is not live. It is refreshed at the sync frequency that you have chosen.
- how to combine two API calls to get your data (e.g. one call to get a list of objects and one call per object to get its data).
- how to modify the API call parameters based on variables modified by the dashboard's viewer (i.e. to create a dynamic web app to query your API).
Live mode: Using the Serenytics REST API connector
In the datasource menu, create a new datasource and in the tab "Web Services & API", click on the "REST API" icon:
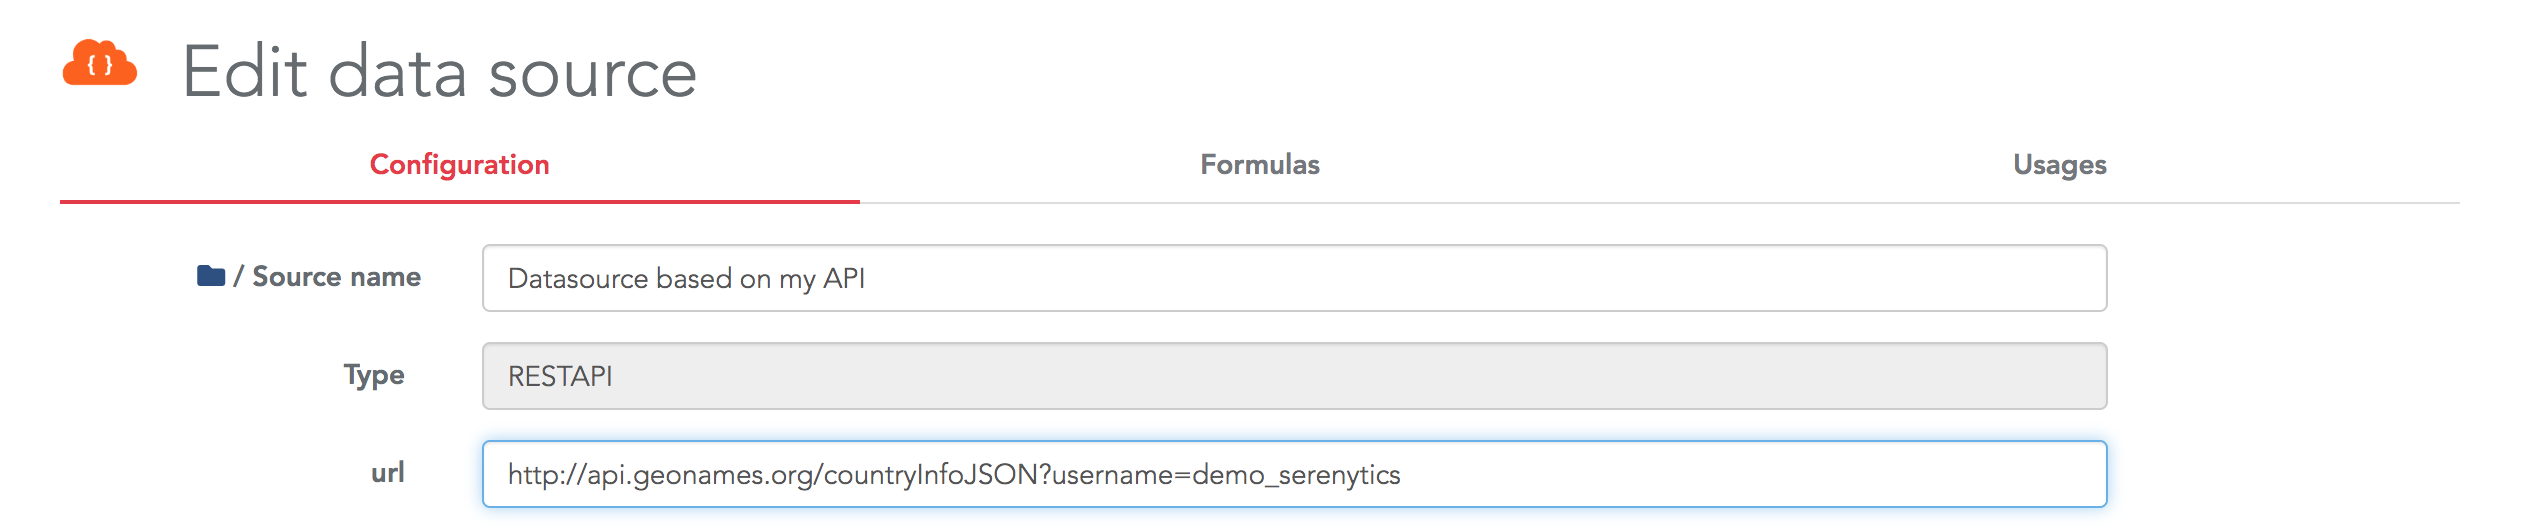
Then, enter the URL of your REST API in the configuration page of the connector:
Then, you need to fill the fields required to obtain data from your API, such as:
- The method to use: GET or POST
- The path to the actual data in the obtained JSON
- The HTTP Headers
- ...
- Flatten sub-objects to create new columns
- Flatten sub-arrays to create new rows
Once your API is configured, a data preview is displayed at the bottom of the config page. Then, you can build your dashboard using this datasource exactly as any other datasource.
Synchronized mode: Using a Serenytics storage
In this mode, the first step is to create a Storage datasource. This will be the table in the internal datawarehouse where your data is stored.
The first option to fill this storage from your API is to create the API connector as described above. Then, create an ETL step automation, using as input datasource this API connector, as output datasource the Storage you just created, and pick the columns you want to obtain from your API. Don't forget to execute this automation in the Execution tab to actually run your ETL step.
If your API is custom and our default REST API connector is not working for you, you will need to write a few lines of Python code to extract data from your API and store it in a Serenytics Storage.
Thanks to the requests and serenytics Python modules, the default code is very simple:
import serenytics
import requests

STORAGE_UUID = 'UUID_OF_THE_STORAGE_USED_TO_RECEIVE_THE_API_DATA'
API_URL = 'http://api.geonames.org/countryInfoJSON?username=demo_serenytics'

r = requests.get(url=API_URL)
json_data = r.json()['geonames']

client = serenytics.Client()
ds = client.get_data_source_by_uuid(uuid=STORAGE_UUID)
ds.reload_data(new_data=json_data)
Note that we removed all the error handling code to make this example as simple as possible. Once this script is executed, the data is available in the provided Storage and you can build your dashboard against it.
Pros/Cons of each method
When using the Serenytics REST API connector:
- Pros
- The dashboard is "Live" (i.e. at each rendering, it queries the REST API to get the latest data).
- Very simple to setup if the requested API is compatible with the Serenytics connector.
- Performances are satisfying for a dashboard with only a few KPIs and small datasets.
- Variables modified by the user can be passed to the API call (see the corresponding advanced use case below).
- Cons
- A dashboard can be very slow if the dashboard requires many queries to the API or if it needs to get a lot of data. As filtering is done on the Serenytics side, if a filter is applied in a dashboard, the Serenytics engine will query the full dataset from the API and then apply the filter on this dataset. The same principle applies for aggregation. This can slow down a dashboard.
- The data format returned by your API might not be compatible with our connector. In this case, you must use the second option to connect your API.
When using a Storage and a Python script:
- Pros
- The performance of the dashboard is a lot better as the dashboard queries its data in a Serenytics storage.
- Whatever the format structure of the data obtained from your API, you will be able to write processing code in Python to upload it in Serenytics.
- Cons
- The data is updated on a regular basis (i.e. at each execution of the Python script). The dashboard is not "Live".
- If your API is custom, you will need a few Python lines.
- Configure the cache on the API datasource.
- Create an ETL step to store the data from this connector in a storage and query this storage in your dashboard. This will be exactly as the Python script above (simpler, but less customizable).
Advanced use case 1: Combine several API calls in synchronized mode
Let's say you need to call a first API to get a list of assets. And then, for each one, you need to make a call to a second API to get information about it. In Serenytics, this is easy to achieve with a few lines of Python.
We have built an example where:
- We query a first API to get a list of random users. The API is https://randomuser.me/api. It returns a JSON with a list of users (only their first and last names).
- For each user, we call the API https://api.genderize.io to estimate its gender from his/her first name.
- In the end, we load the enriched list of users (first name, last name, estimated gender) into a storage.
Here is the code for this example (without error handling to simplify the reading):
import serenytics
import requests
client = serenytics.Client()

# This script runs a first API call to get a random list of users
# then, for each user, it calls another API to estimate its gender
# then, the list of users with their genders is uploaded in a storage.
# You need to create this storage first (and copy its UUID in the params below).

# --------------------------- PARAMETERS ---------------------------
# UUID of the storage where to store the data
DESTINATION_DATASOURCE_UUID = 'ENTER_HERE_THE_UUID_OF_A_STORAGE_YOU_CREATED'
NB_PEOPLE=5
# ------------------------------------------------------------------


# --- get a list of random people
url1 = f"https://randomuser.me/api/?results={NB_PEOPLE}&inc=name"
r = requests.get(url1)
list_of_users = r.json()["results"]
print("===> List of users")
print(list_of_users)

# --- call the API for each user to estimate its gender
print("===> Querying genders")
new_data = []
for user in list_of_users:
    print(f"   ===> Querying gender for user '{user['name']['first']} {user['name']['last']}")

    # --- generate the URL to query for this sensor
    url_to_query_data_for_this_user = f"https://api.genderize.io?name={user['name']['first']}"

    # --- query it
    print(f"Querying URL: {url_to_query_data_for_this_user}")
    r = requests.get(url_to_query_data_for_this_user, verify=False)
    res = r.json()
    print(res)

    # --- map the data in a simple flat format (each input will be a column in the destination table):
    new_row = {
        "first_name": user['name']['first'],
        "last_name": user['name']['last'],
        "estimated_gender": res['gender'],
        "estimated_gender_probability": res['probability']
    }
    new_data.append(new_row)

print(f"===> Uploading data to destination table")
destination = client.get_data_source_by_uuid(uuid=DESTINATION_DATASOURCE_UUID)
destination.reload_data(new_data=new_data)
You can copy and execute this automation in your account. Please, do not increase the number of people queried in this example as there is a rate limitation on the randomuser.me/api API.
Advanced use case 2: Use dashboard's variables in your API connector
The REST API connector can be configured with variables and these variables can be filled by the dashboard viewer. This is useful to create advanced apps to query you API. Let's build an example to be more explicit.
We'll use the free API: https://randomuser.me/. This API returns randomly generated users. You can open this URL in your browser to check the output of this API: https://randomuser.me/api/?results=5&inc=name.
In our example, we'll build an API connector with this URL: https://randomuser.me/api/?results={{nb_person}}&inc=name
Here, the value nb_person is specified between double curly brackets. This means it is a variable and it can be replaced by an actual value. First, we must provide a default value. This is a property of the datasource defined in the field Datasource variables. This must be defined as a JSON dictionary:
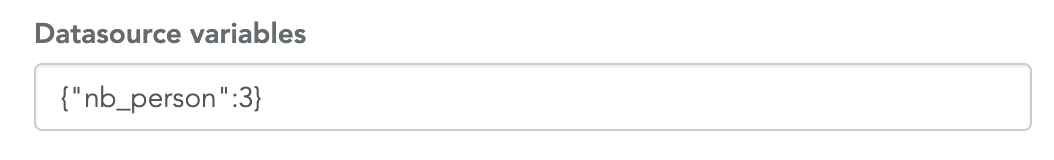
This value will be used to replace {{nb_person}} in the URL. This templating mechanism can be used in the API URL and also in the HTTP Payload field.
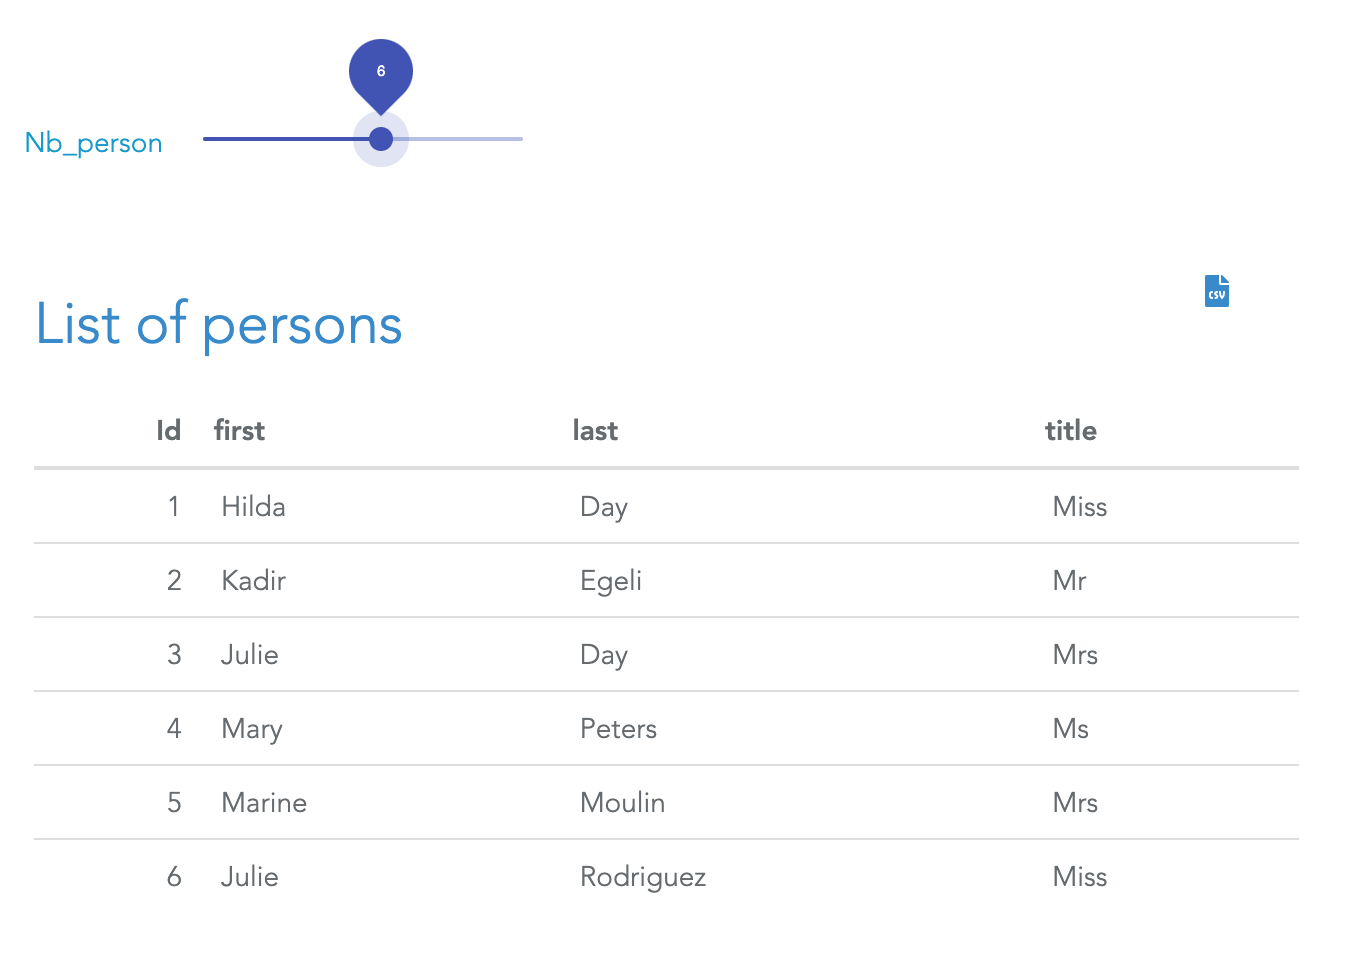
Then, in a dashboard, you can create a dynamic filter (either a dropdown, an input field or a slider) that will overwrite this value. In the below example, the variable nb_person is filled by a slider so the dashboard's viewer can modify this value:
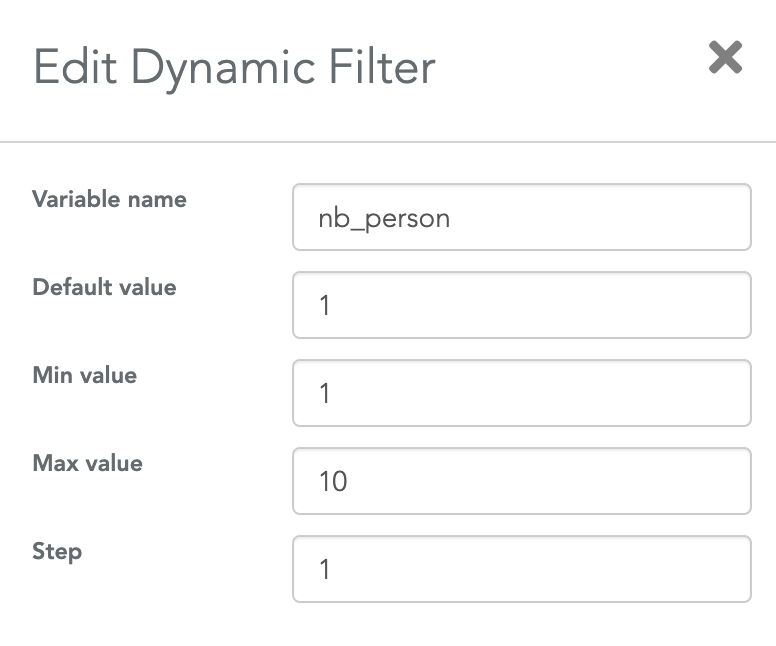
The only configuration you need in the dashboard is to specify to the slider (or any filter/input field) that is must save its value in the variable named nb_person. This is done in the filter's settings:
Using this mechanism, in a few clicks, you can create advanced apps to query your API and display the results.
Conclusion
Serenytics has several ways to create dashboards querying your API. If you're not sure about the best way to connect and use your API, contact us at contact@serenytics.com
×![]()