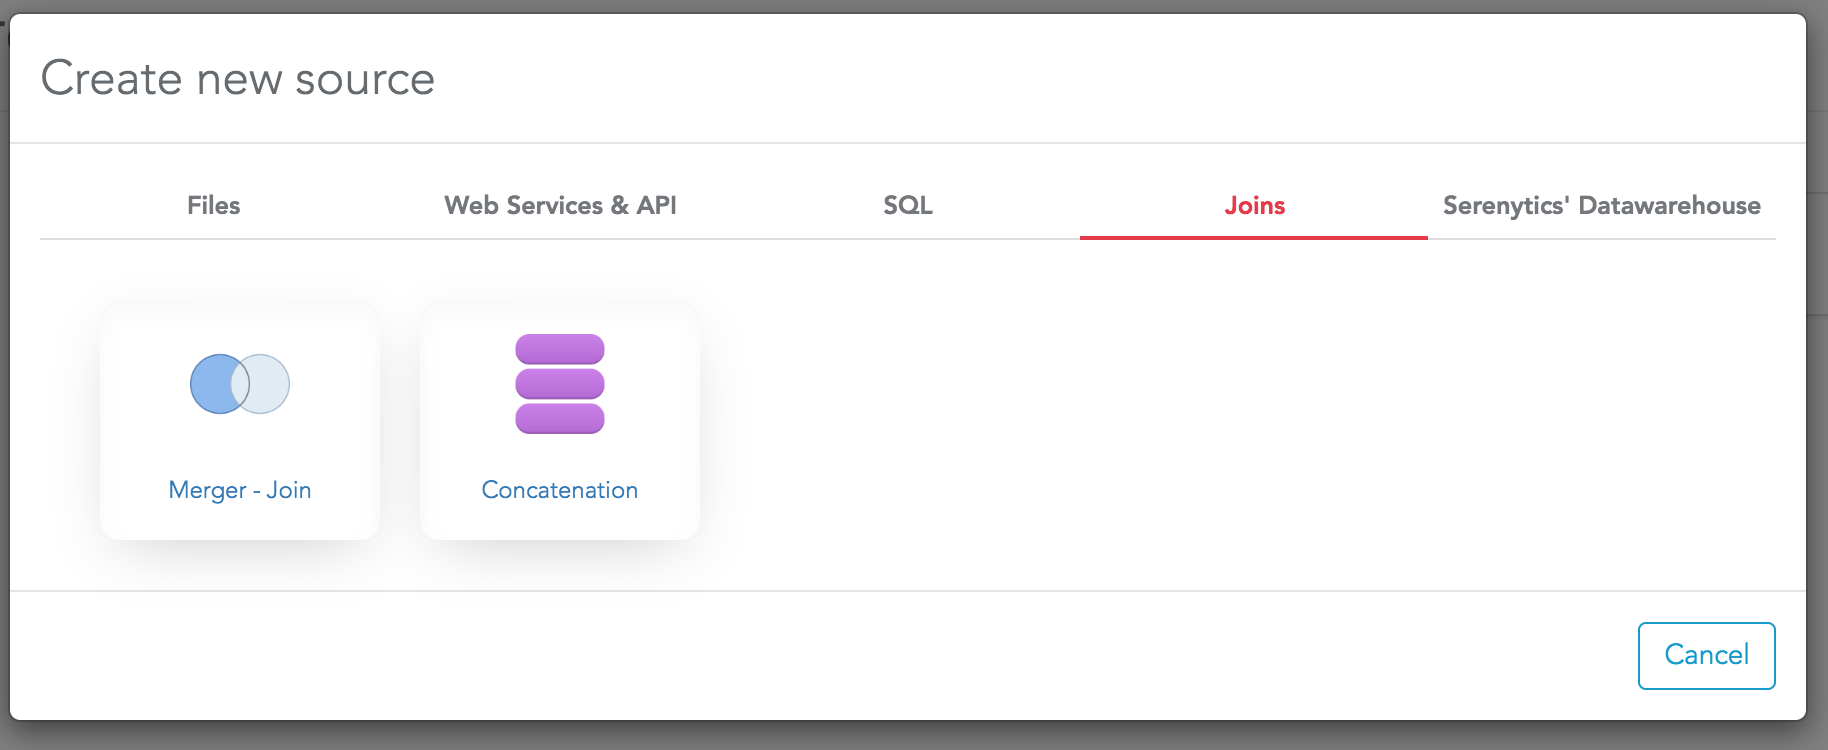
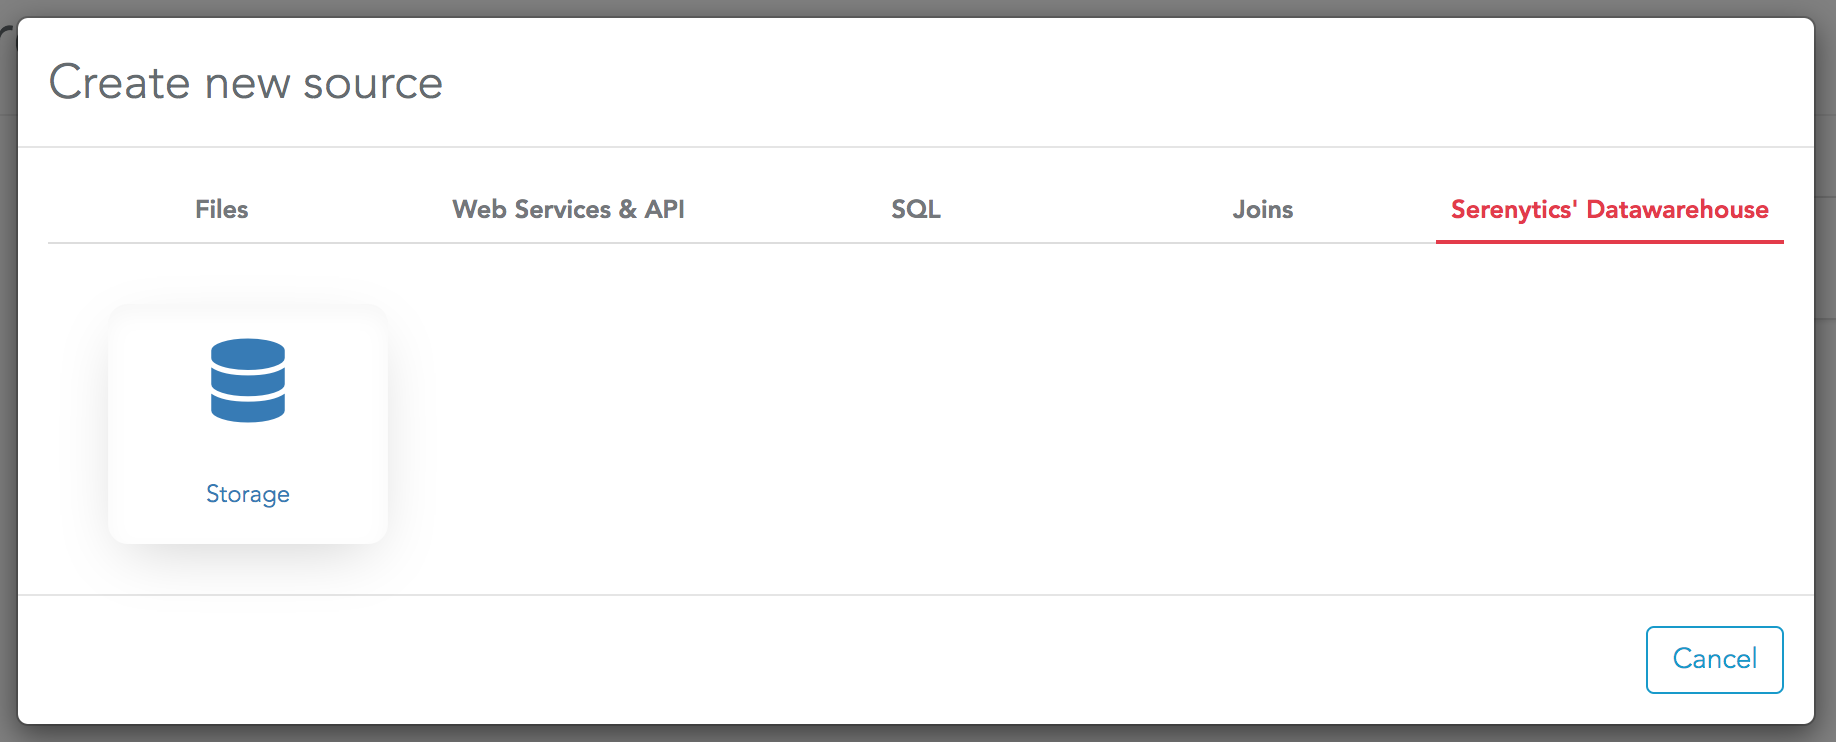
Connect a datasource

- Files
- Web Services
- SQL tables
- Joins between several datasources
- Storages
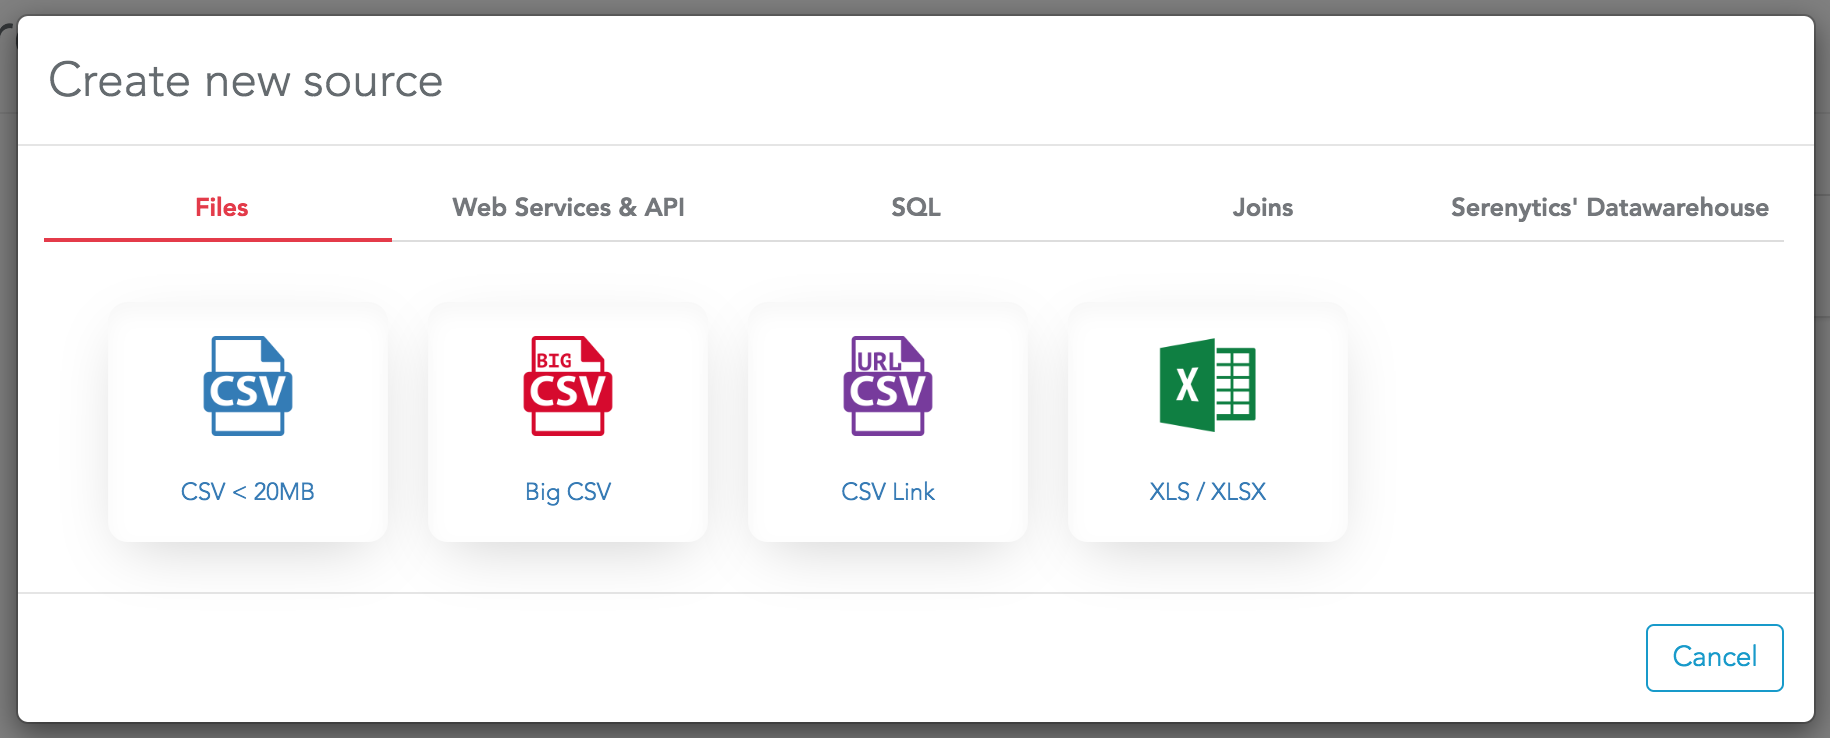
You can upload XLS or CSV files into Serenytics. When a file is uploaded, Serenytics has a copy of it. The data queries are run on the copy of the file.
The "BigCSV" option lets you upload very large CSV files (up to millions of rows). When you upload a CSV file with this option, it is loaded in the internal Redshift datawarehouse of your account. Then, queries are run against this datawarehouse.
The "CSV link" option lets you connect to a CSV file hosted somewhere else and available through an URL (e.g. like an S3 file). Serenytics does not copy the file locally. Queries are run against the distant file. So the dashboards always use the latest version of the file.
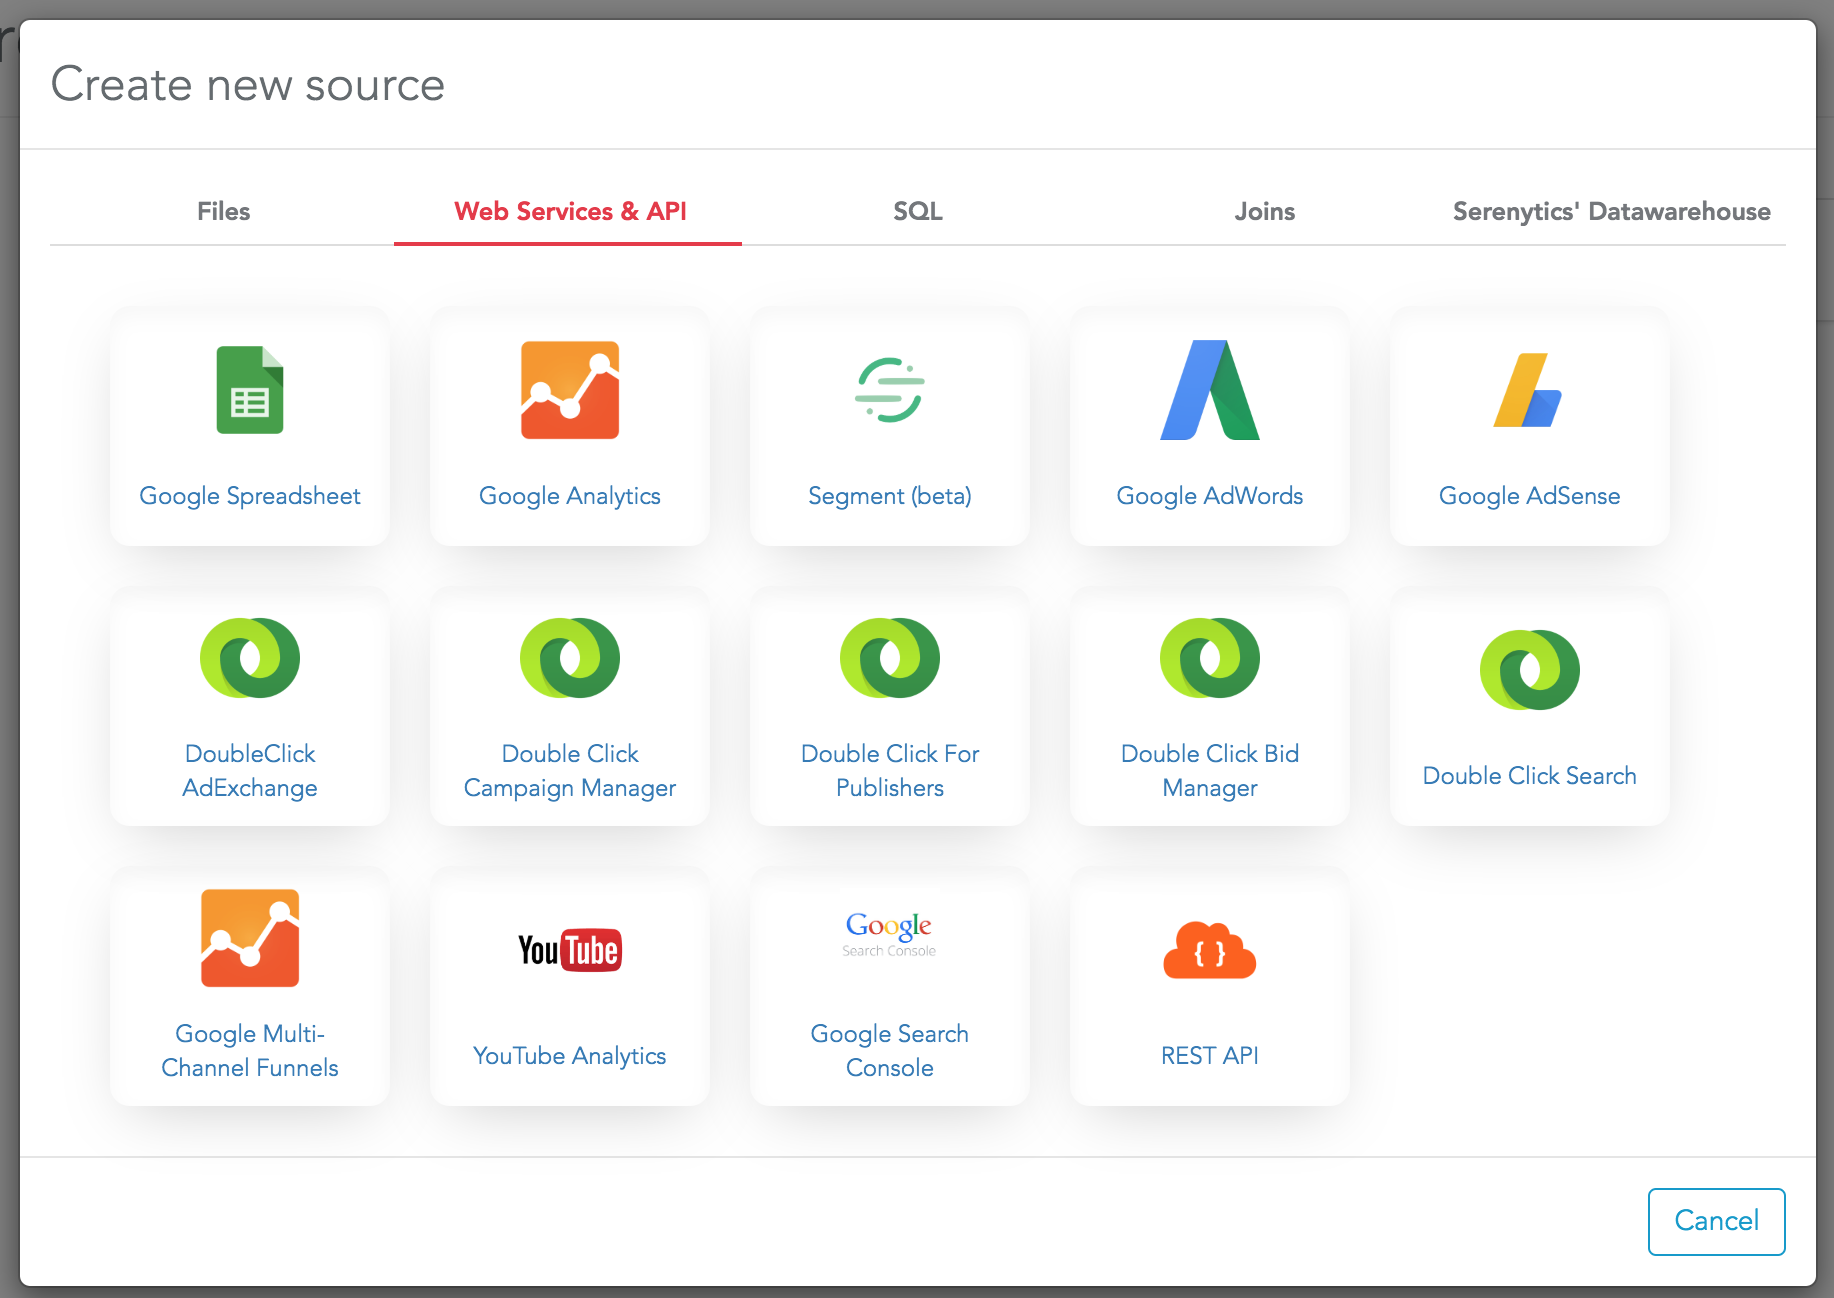
Serenytics does not copy the data from a webservice into Serenytics. Each data query will query the distant API of the webservice. So the data will always be the latest data, but it may be slow if you query a lot of data.
If you need to copy the data into Serenytics for performance reasons, you need to create an "ETL step". Using an "ETL step", you will be able to trigger a data sync between the webservice and the Serenytics internal datawarehouse.
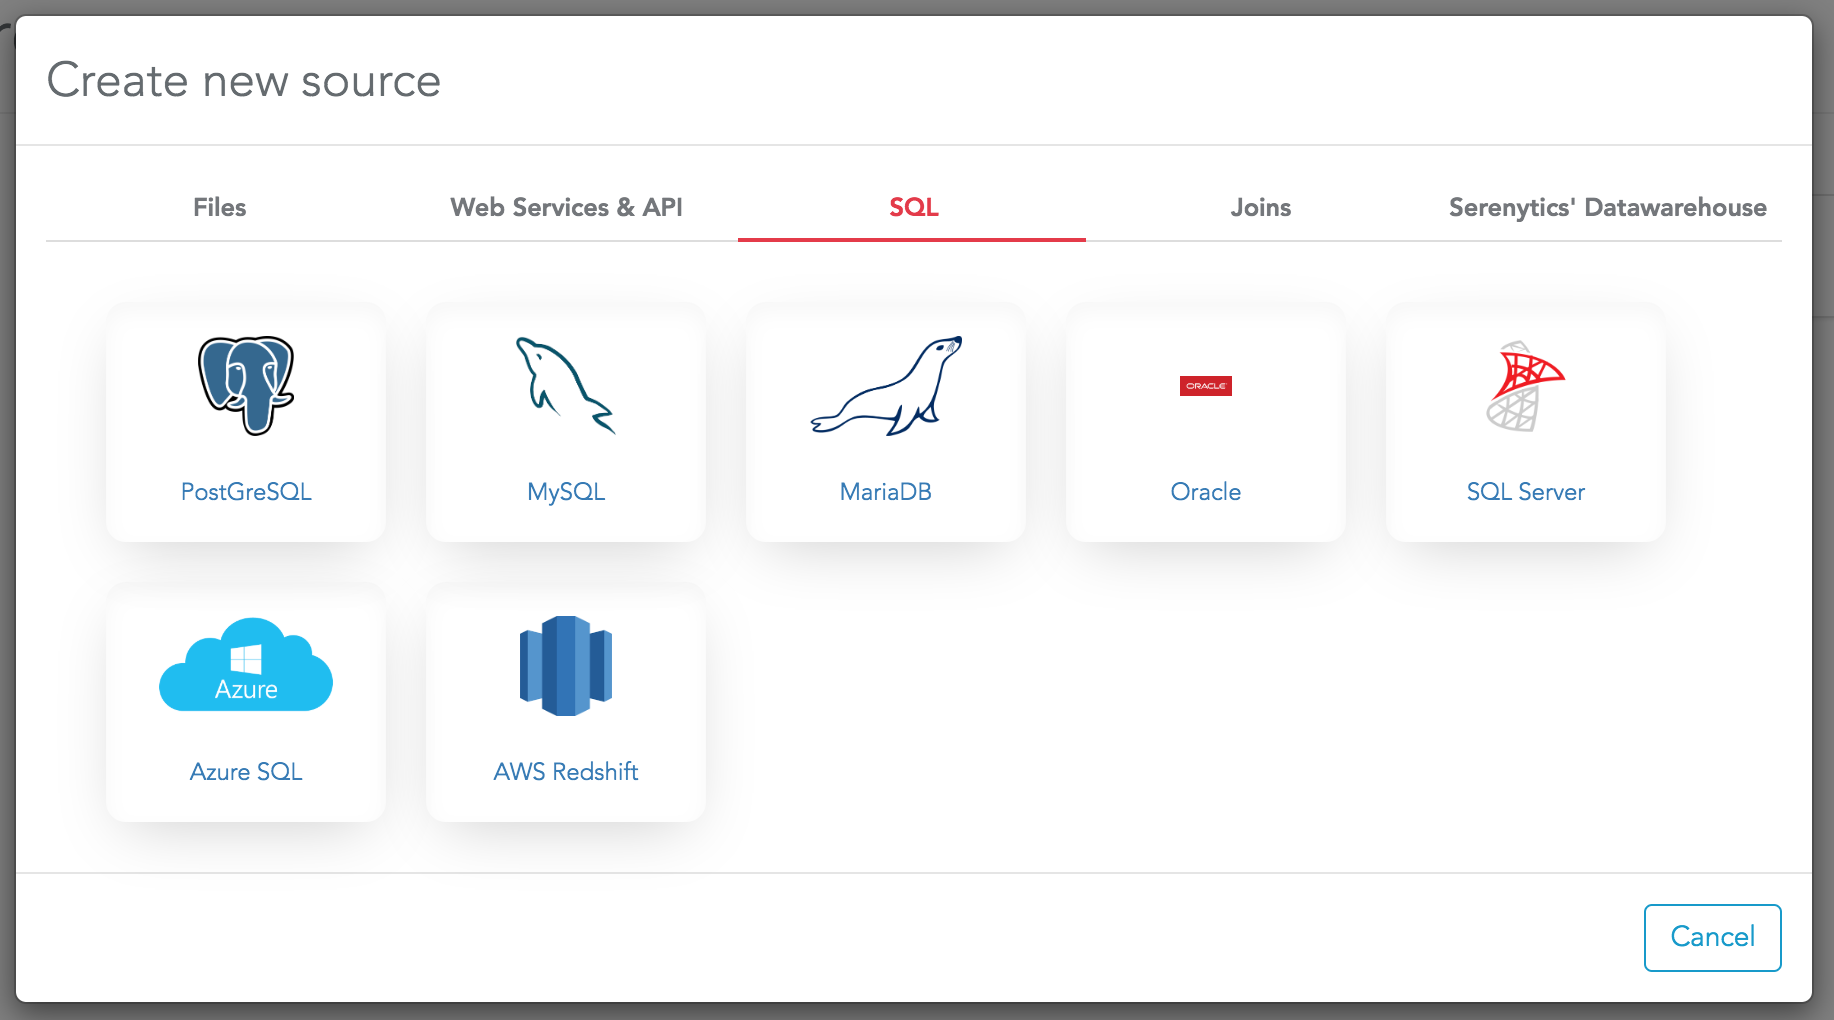
You need to create one datasource for each table you need to use for your dashboards.
By default, we don't copy the data from the SQL server to Serenytics. Your queries will be executed directly on your SQL server.
If you need to copy the data into Serenytics for performance reasons, you need to create an "ETL step". Using an "ETL step", you will be able to trigger a data sync between your SQL server and the Serenytics internal datawarehouse.
Most joins are created between tables from the same SQL server. It is possible to create joins between datasources from different origins (e.g. one datasource from an SQL table and one XLS file). This will work but it will be very very slow.
If you need to create joins between several different origins of data, we strongly advise to sync all your data in the internal datawarehouse (i.e using storages and ETL steps) and then to create your joins on these datasources.
- Using an "ETL step" to load data from any other datasource.
- Using an "(S)FTP task" to schedule a data loading from a CSV file on a FTP server.
- From a Python script to load data from a file or from a Pandas dataframe.
- By pushing JSON objects to our API.
For each datasource, once you have created it, you need to configure it.
It can be as simple as selecting the worksheet to use for an XLS file (it uses the first worksheet by default). For an SQL table, there are more fields as you need to provide your SQL server details.
But eventually, once your datasource is correctly configured, a data preview will be shown in the configuration page. It shows the first 100 rows of your dataset:
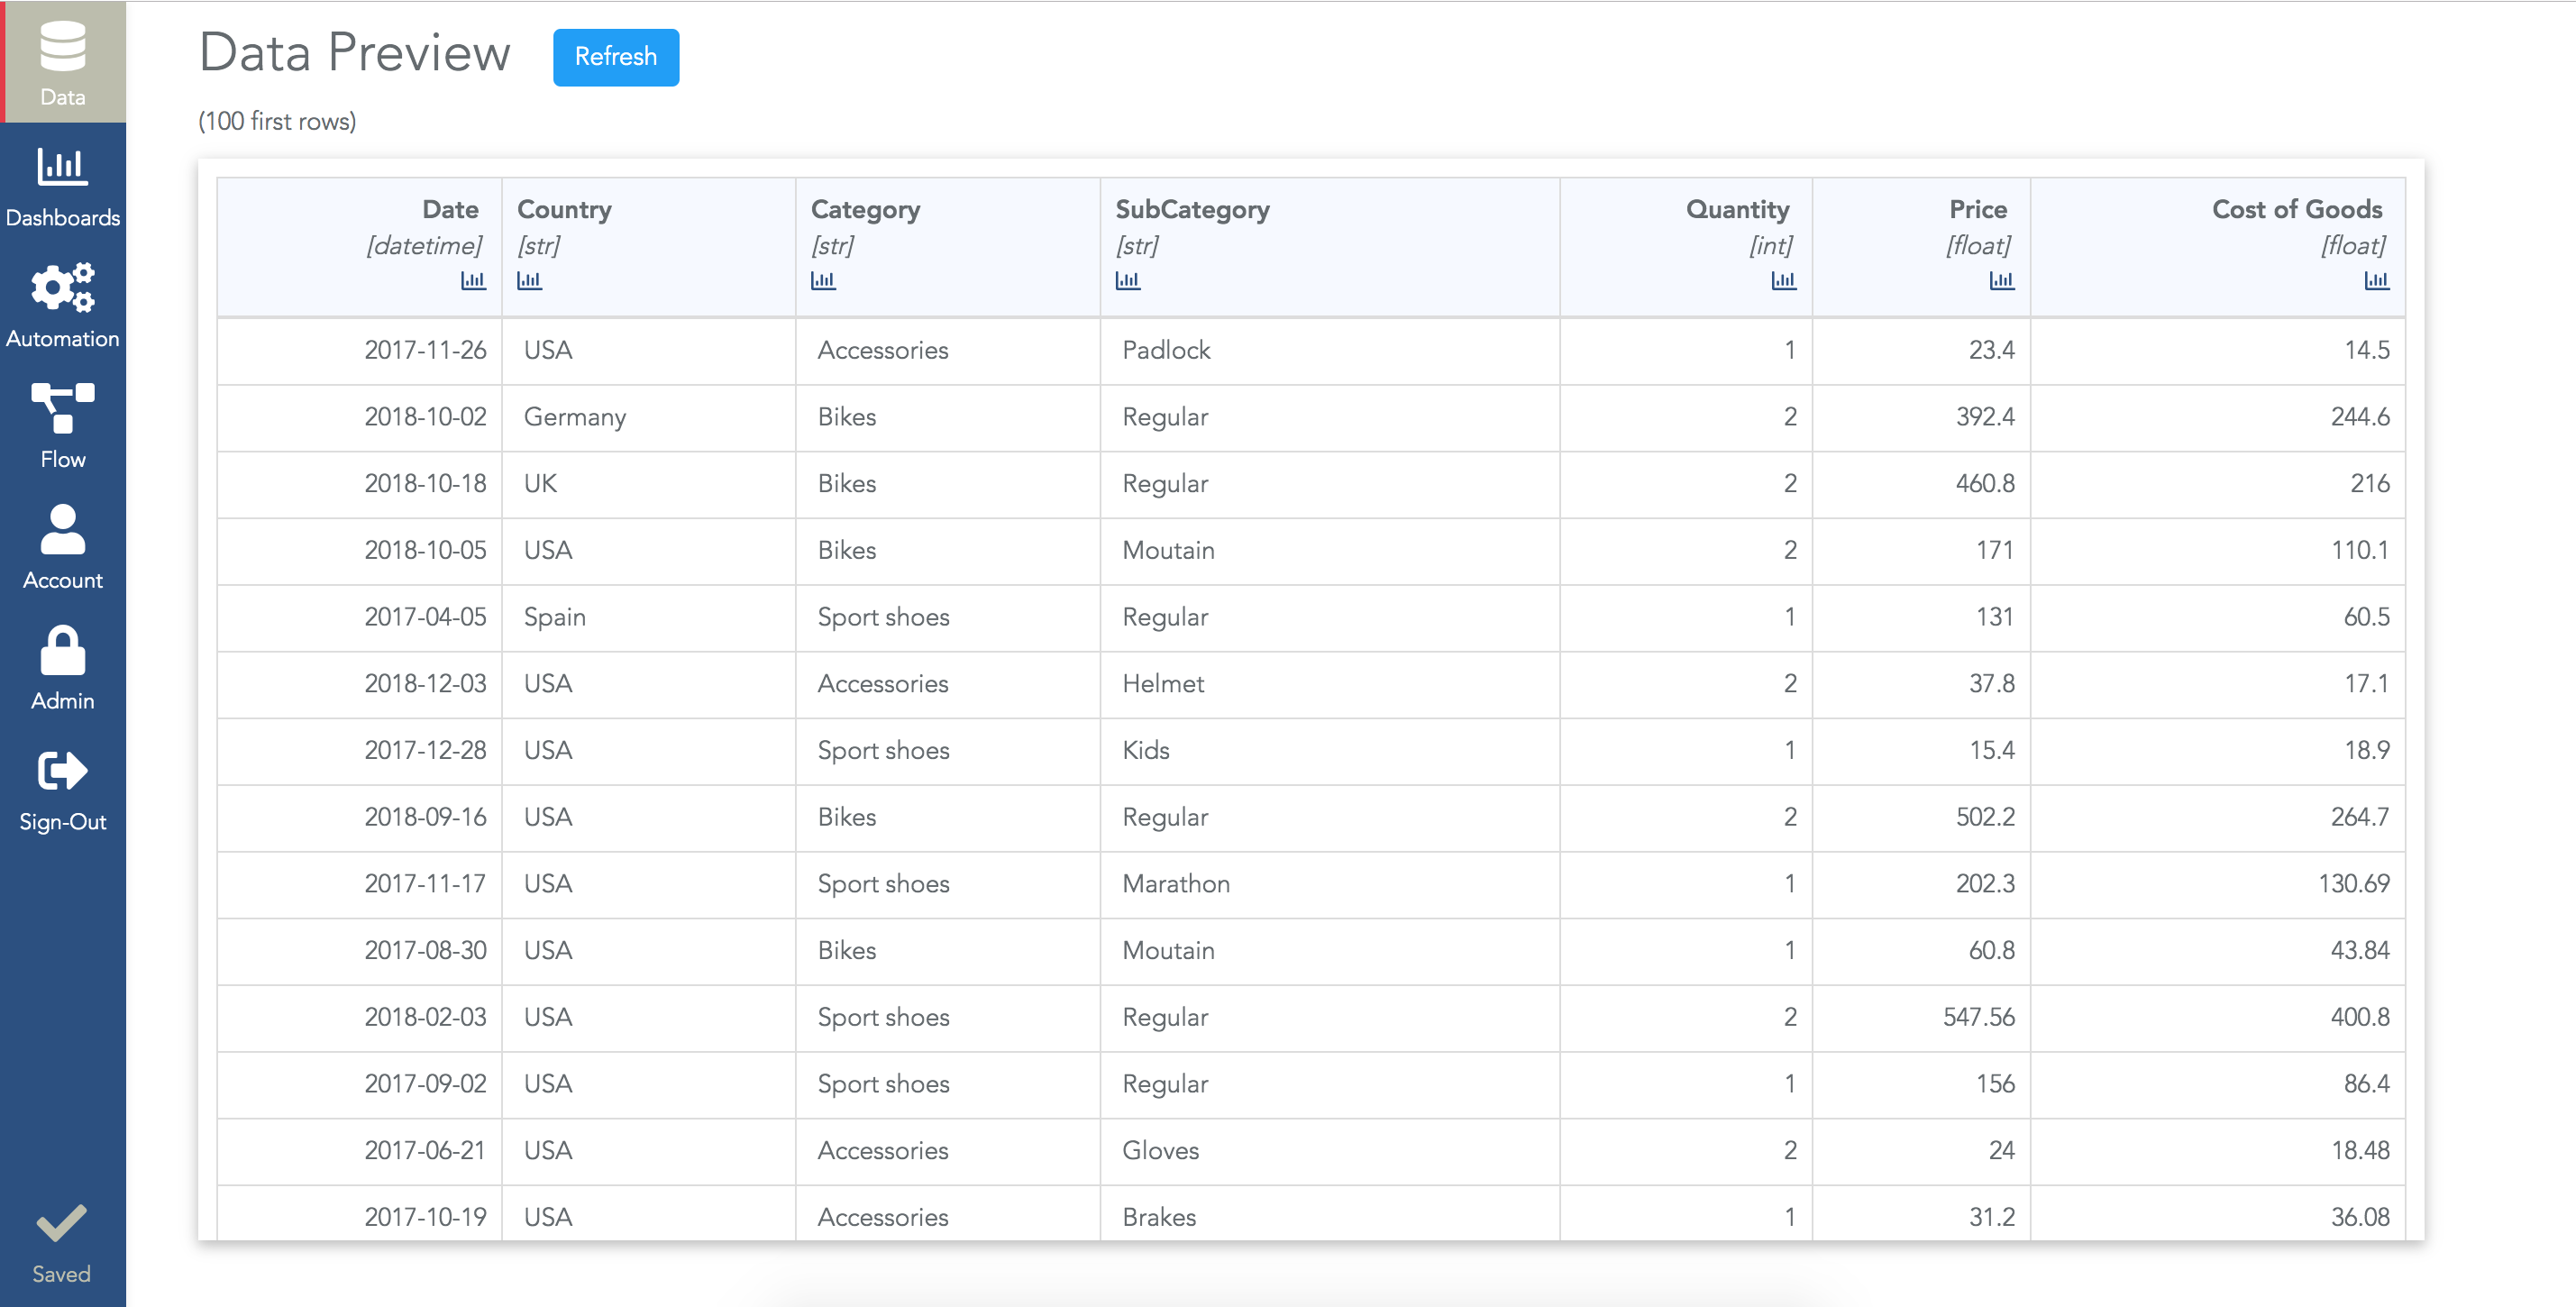
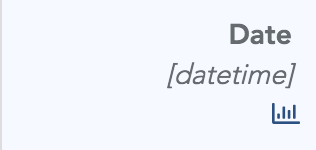
- The first one is the header's name.
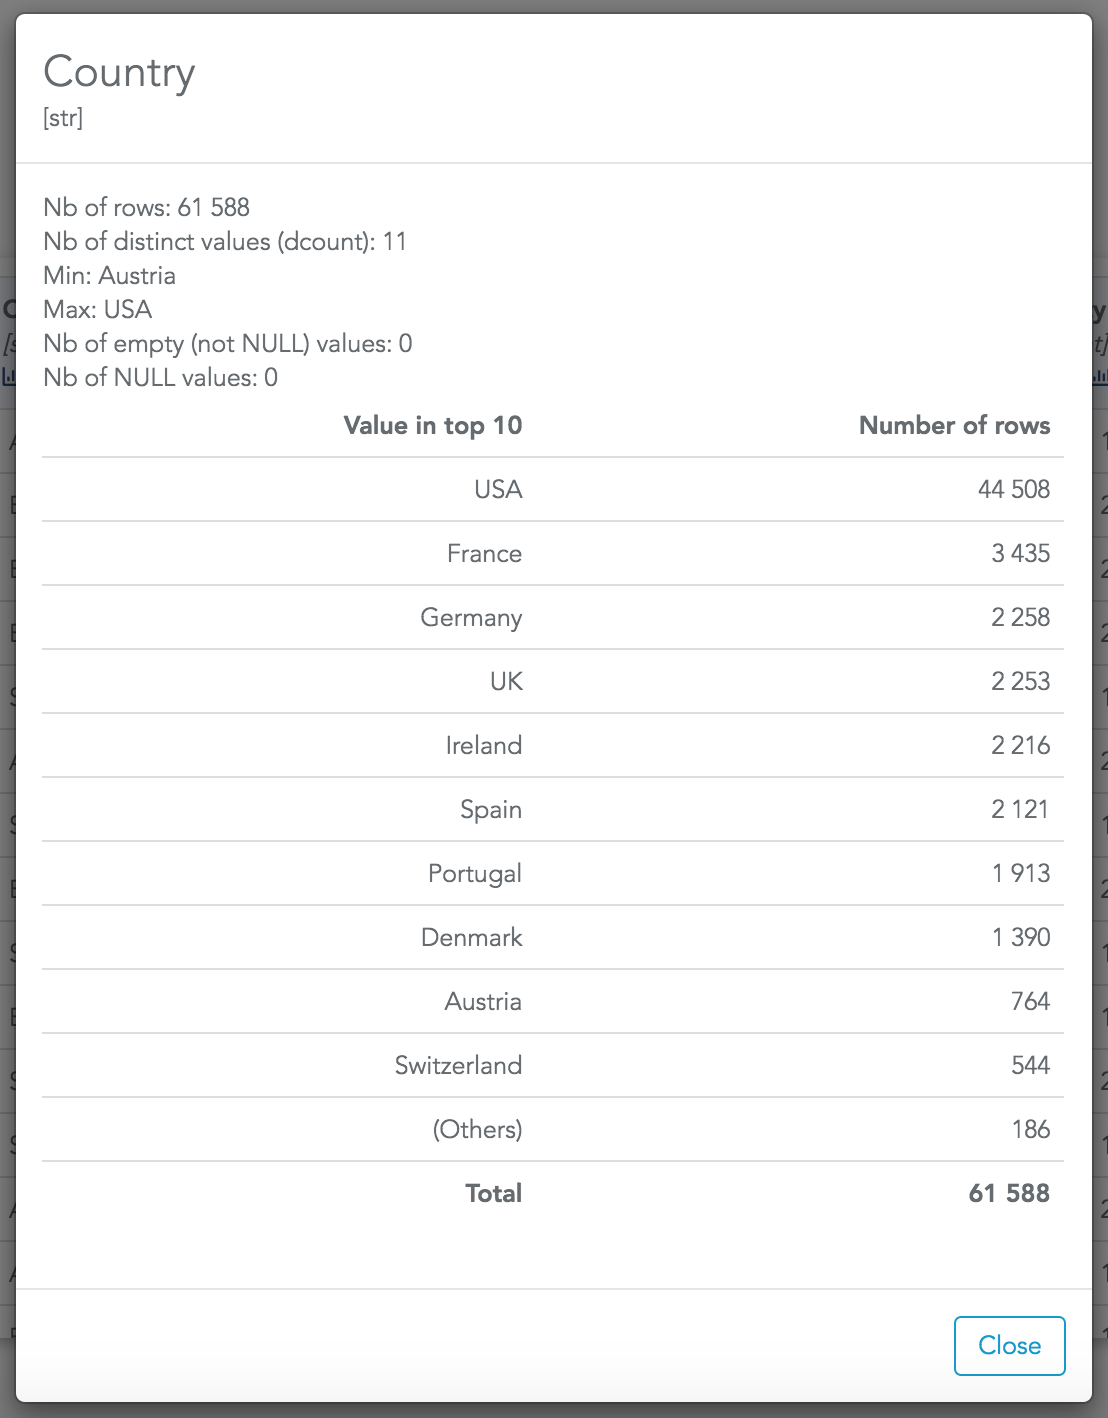
- The second one is its type. It's very important to check that the types are correct when you connect data as the type will enable/disable some options for this column. For example, if a column is detected with the datetime type, you will be able to group data by month, quarter, year...
- The barchart icon to inspect the column (see details below).
If you click on the barchart icon, default statistics for the column are shown: