Configure the cache engine for performance

When a dashboard is loaded, many data queries are sent to the Serenytics data engine (one query by widget). Each query is targeted to a given datasource.
The complete flow for a query when a widget needs its data is:
- The query is created in the dashboard.
- The query is sent from the dashboard to the Serenytics engine.
- Our engine translates this query in a language understandable by the datasource.
- The translated query is executed on the datasource.
- The result is obtained from the datasource and sent back to the dashboard.
The step that can be long is step 4: the actual computing to obtain the result of the query.
In the scenario where the data is updated once per day (e.g. each night), without using the cache, the same query (step 4) will be executed as many times as a widget is drawn (i.e. at each dashboard load or refresh).
If the computation takes 5 seconds, all the viewers will have to wait for these 5 seconds. If someone refreshes the dashboard many times a day, he will have to wait these 5 seconds each time.
If the cache is activated, when a query needs to be executed (step 4), before actually executing it in the datasource, we check if we already have the result.
- If so, we don't execute the query again, we only send back its results, so it's very fast.
- If not, the query is executed and its result is stored in the cache so the next time it is triggered, it will be retrieved from the cache.
The complete query flow with the cache is:
- The query is created in the dashboard.
- The query is sent from the dashboard to the Serenytics engine.
- If the result is already in the cache, just read it (no need to compute it again).
- If the result is not in the cache, translate the query in a language understandable by the datasource, compute it on the datasource and store the result in the cache.
- The result is sent back to the dashboard.
If you're on the tech side, here is a more technical version of the query flow. Skip this part if you just want to know how to setup the cache.
- The Javascript frontend generates the query in the JSON format.
- The frontend sends an HTTP POST message to our backend API with this JSON object.
- Our backend API receives the JSON query, computes a cache key for it and checks in the cache (i.e. a Redis database) if the query result is already available:
- If it is, it reads the result.
- If not, it translates the query from JSON to SQL and executes it on the datasource. Then it stores the result in the cache so it's available for next occurrences of this query.
- The result is sent back to the dashboard as a JSON object.
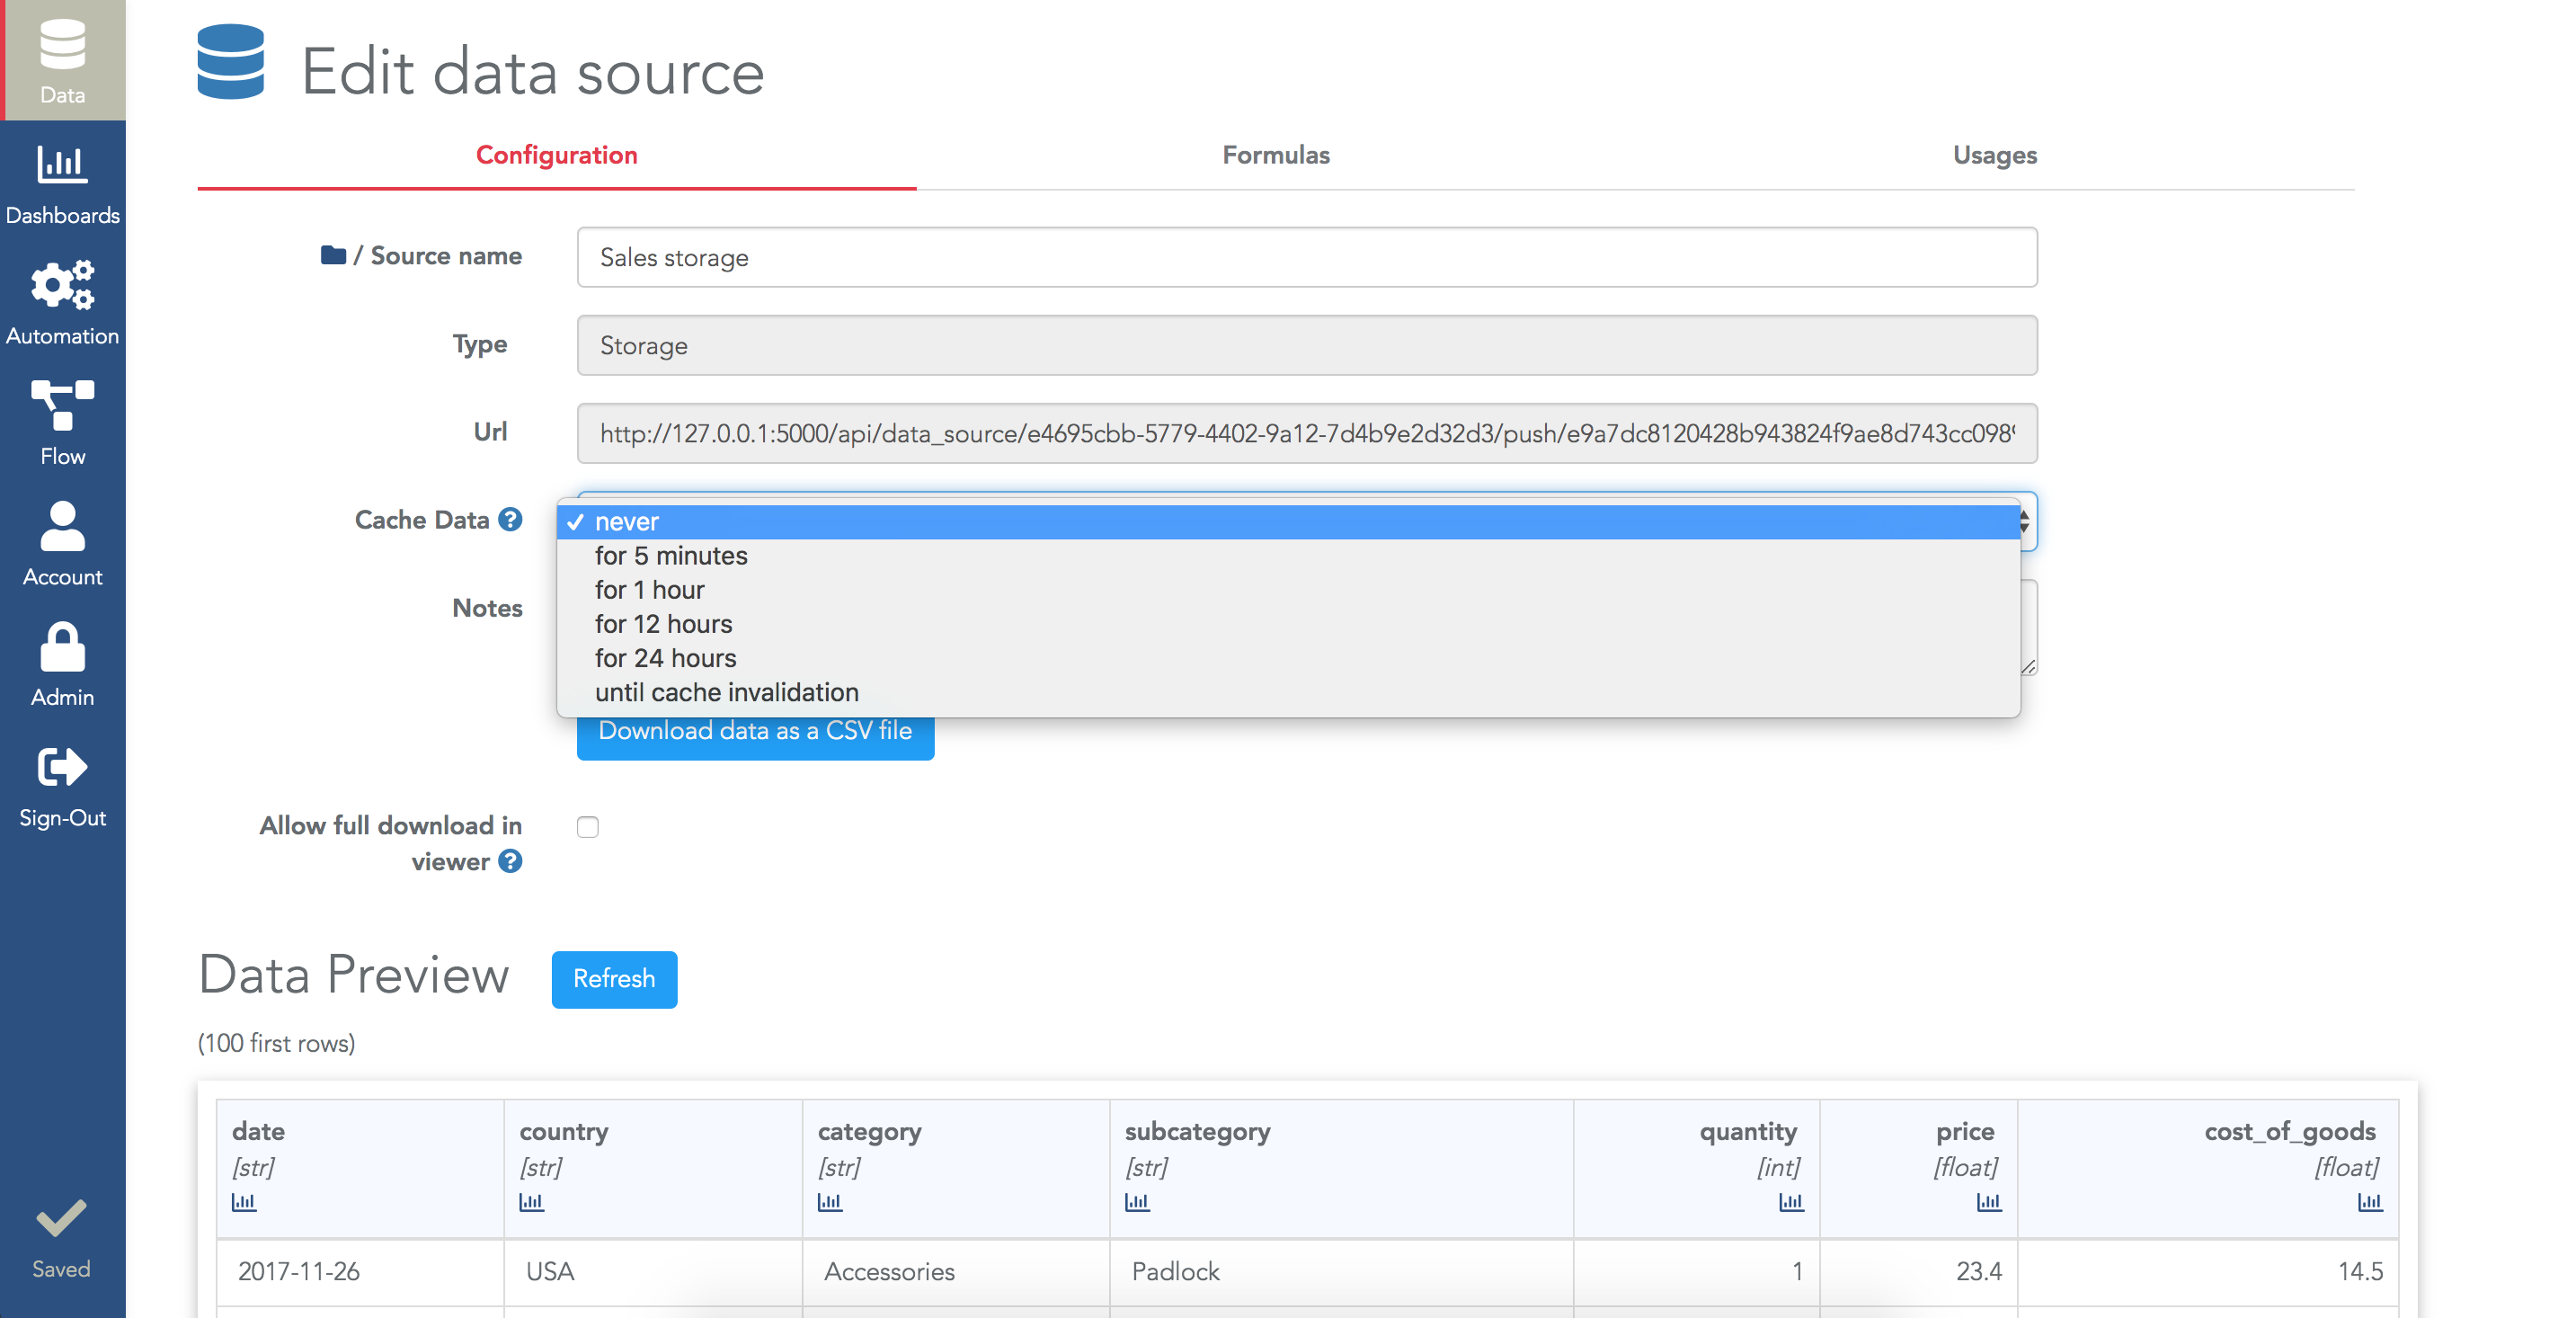
To activate the cache on a datasource, in its configuration page, open the Cache Data field and select the time duration (i.e. the duration a result must be stored in cache).
We strongly recommend that you choose "until cache invalidation". With this option, the results in cache will be kept until the datasource data is modified, reloaded or until the cache is manually invalidated (see Refresh dashboard cache task below):
For projects where the data is updated once a day, it's a good practice to activate the cache in mode "Until cache invalidation" for each datasource of the project.
When you activate the cache for a dashboard, there is still one issue. For the first viewer of the dashboard, the cache will be empty and the dashboard might be long to load. If your data is updated every night, this happens for the first user opening the dashboard in the morning. He's the first at the office and he's the one who has to wait for the data to show up, that's not fair.
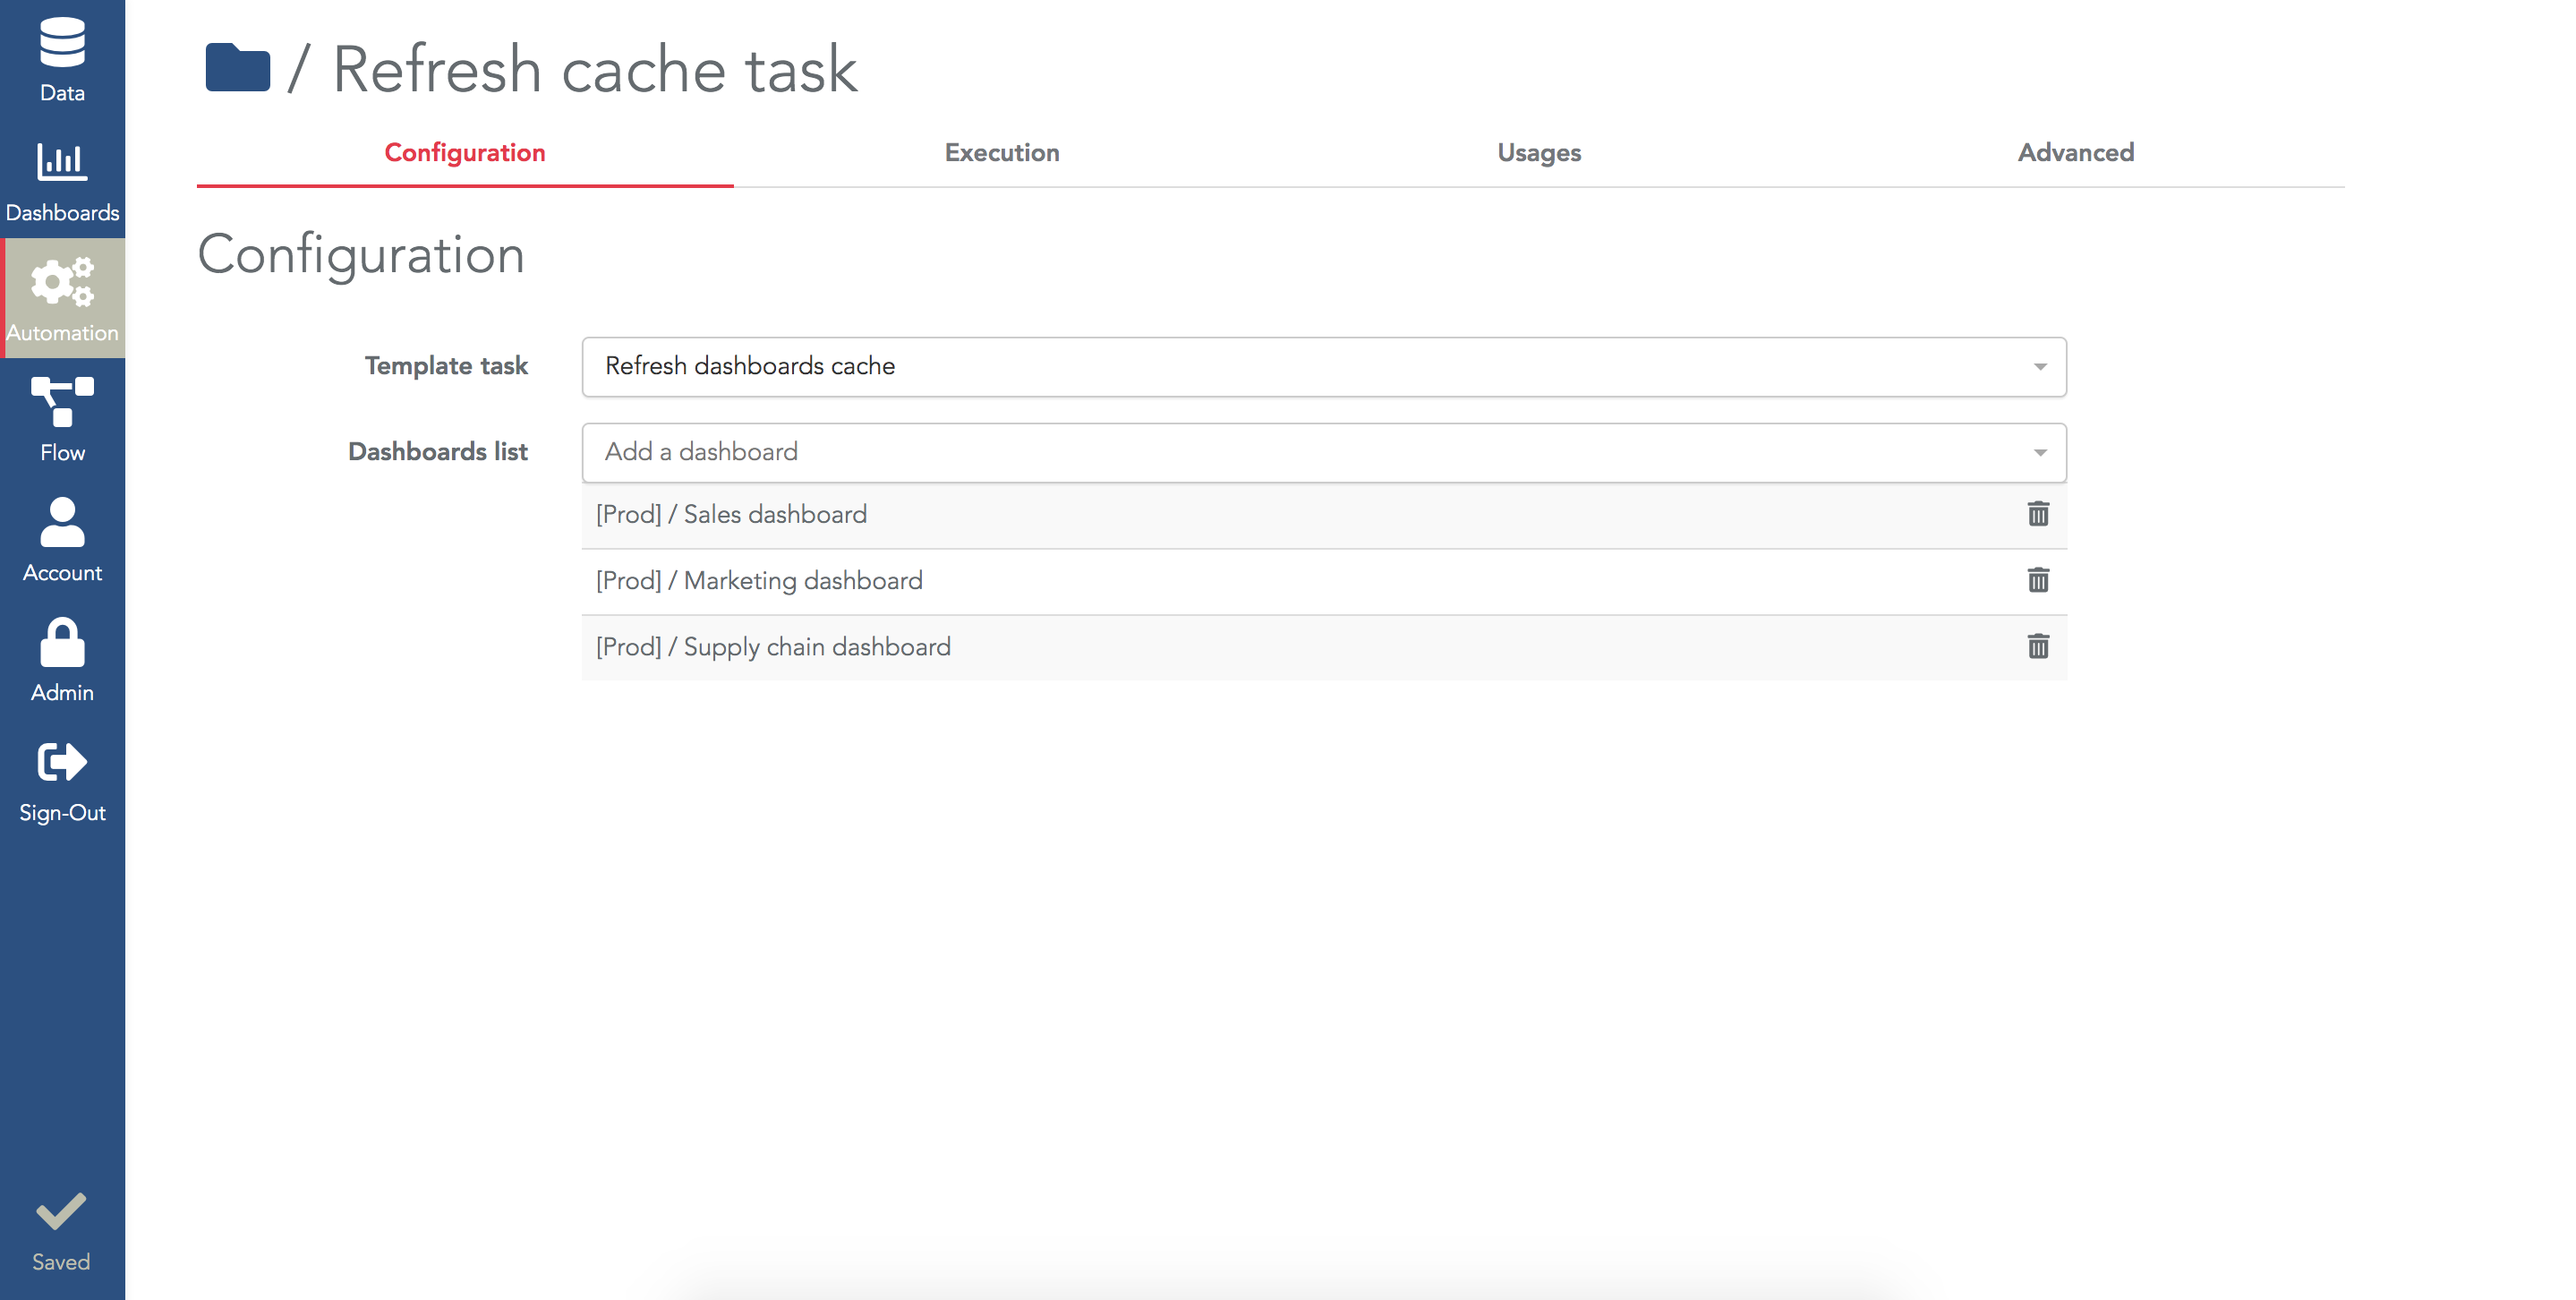
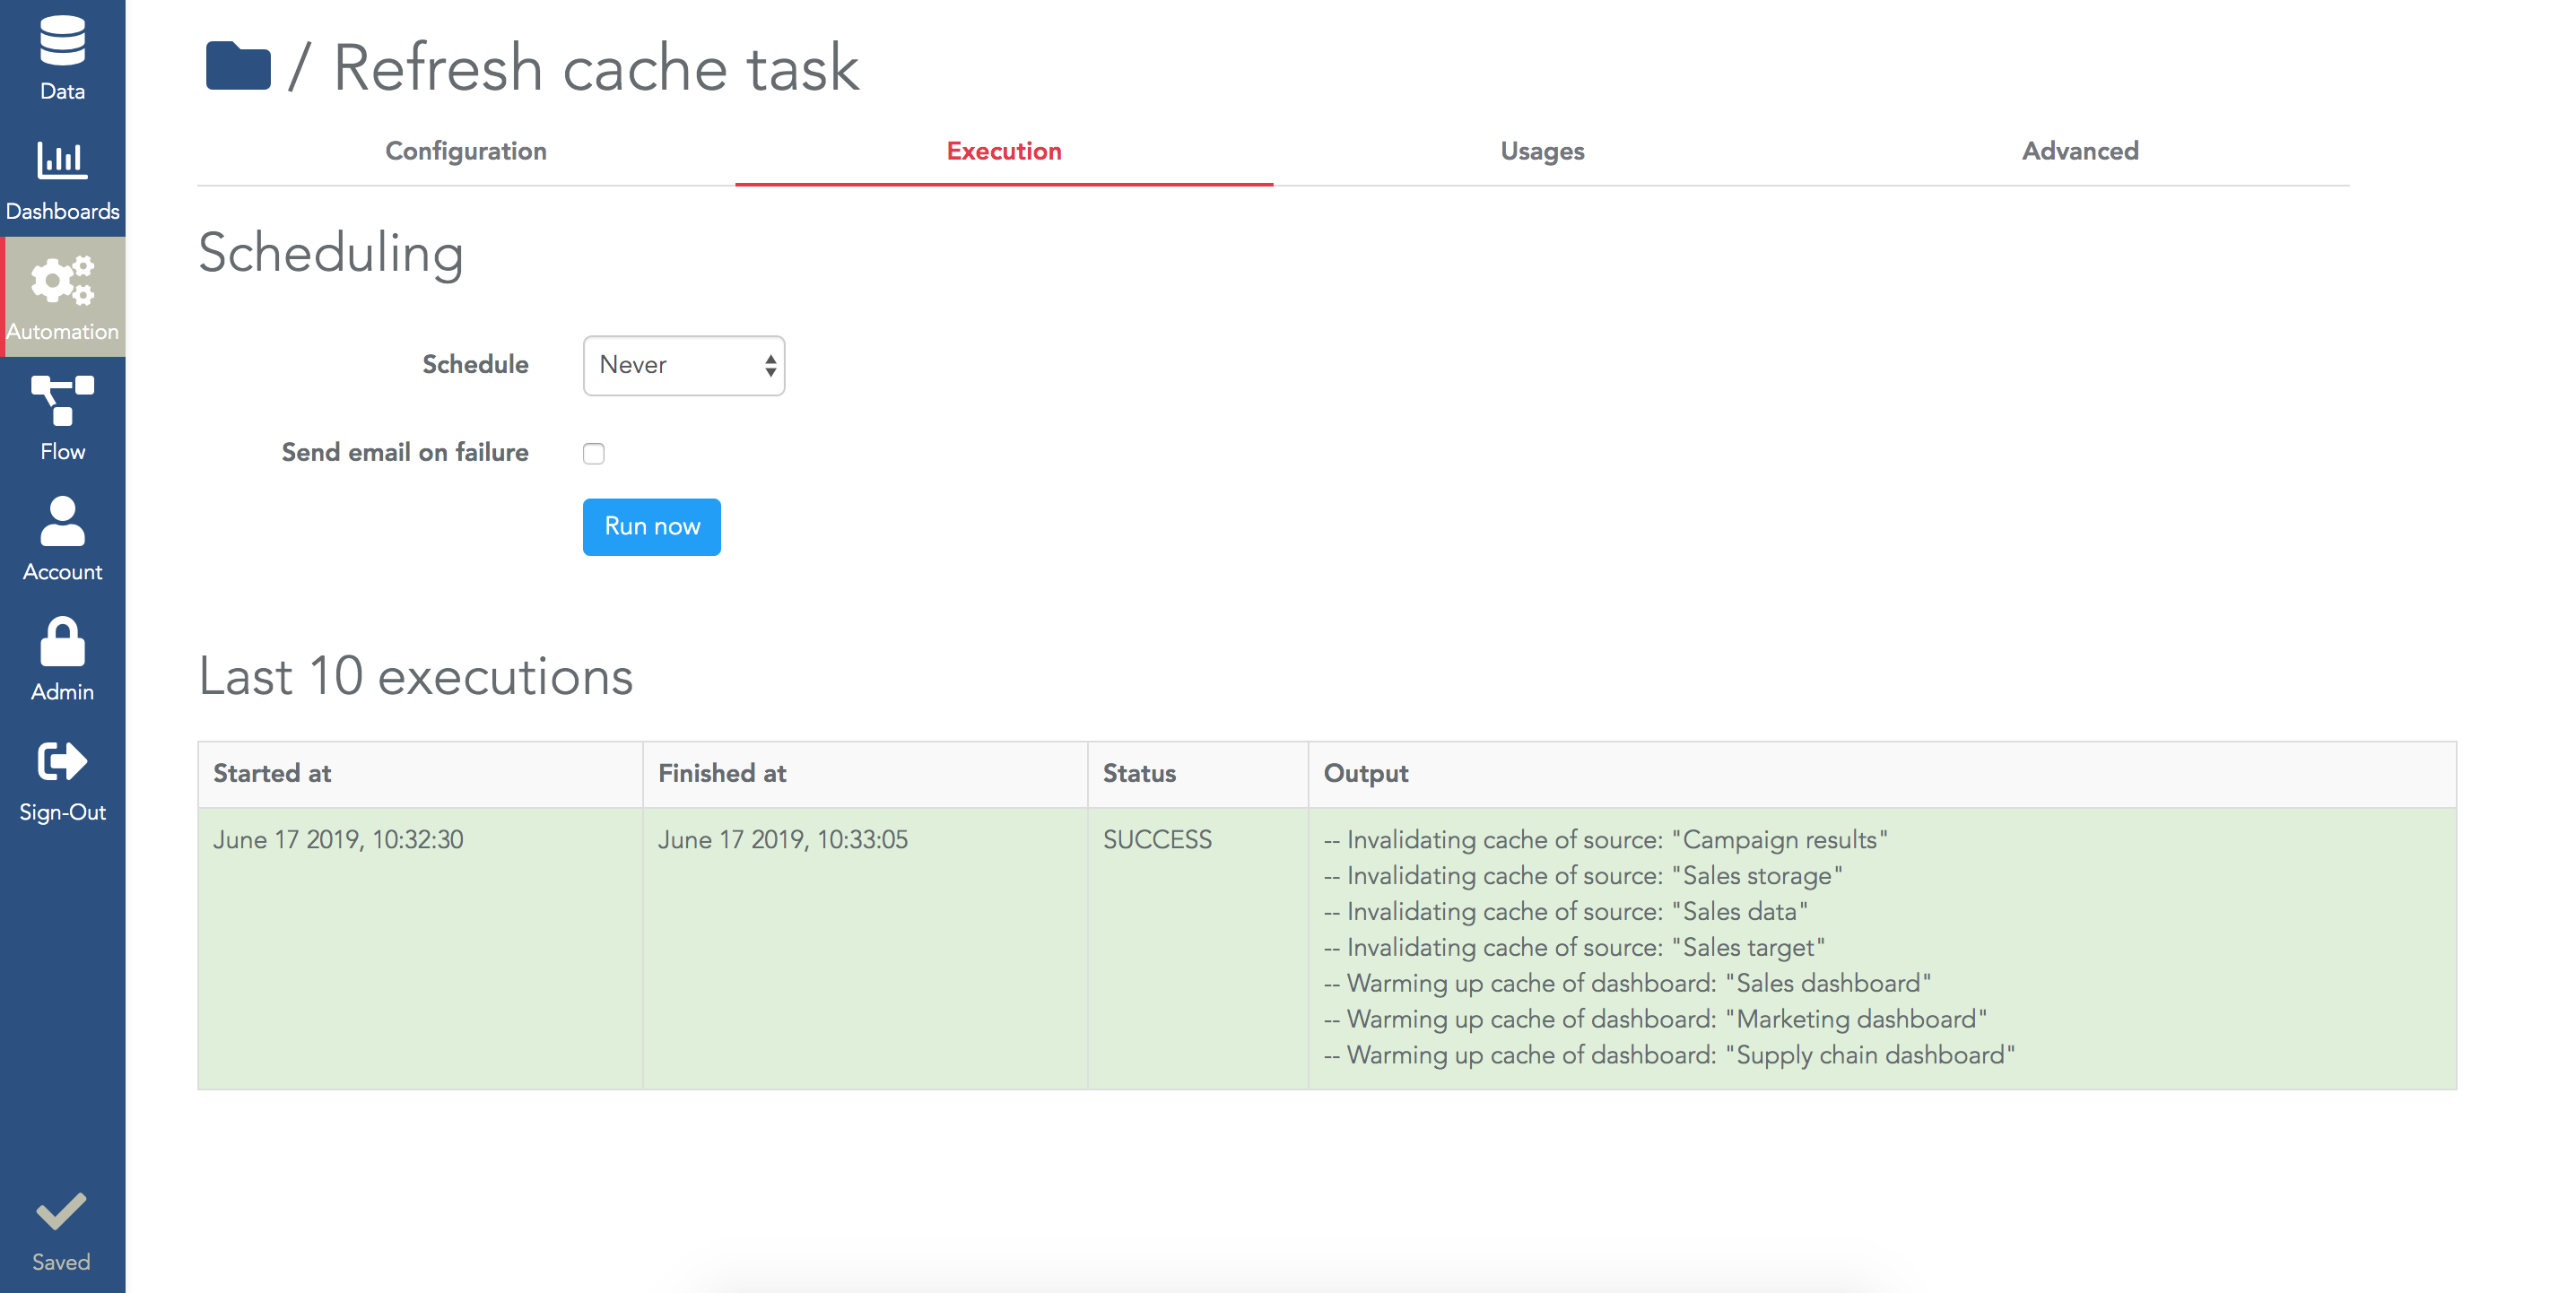
The solution is to pre-load the cache, i.e. simulate the dashboard loading so the cache is already filled. To do that, in the automation menu, create a new Task and select the template "Refresh cache".
In the configuration of this task, select all the dashboards you want to preload. The task will invalidate the cache for all the datasources used in this list of dashboards and then it will preload the cache for all these dashboards. After the execution of this task, you are sure that the dashboard will be very fast to open for the viewers (even for the first one):
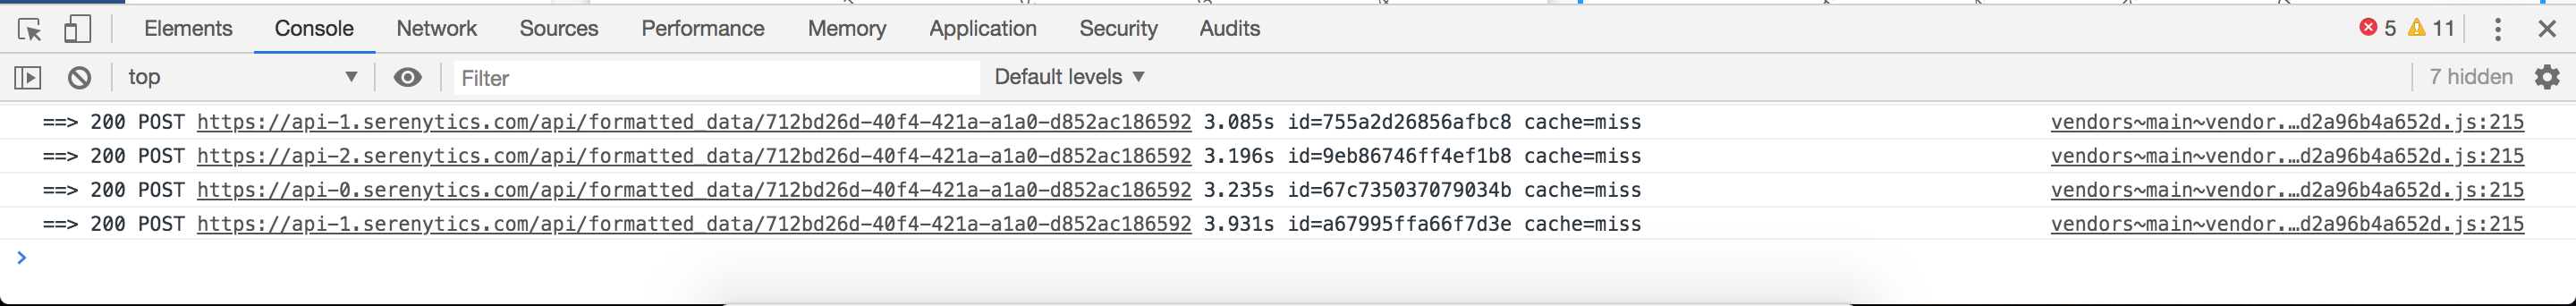
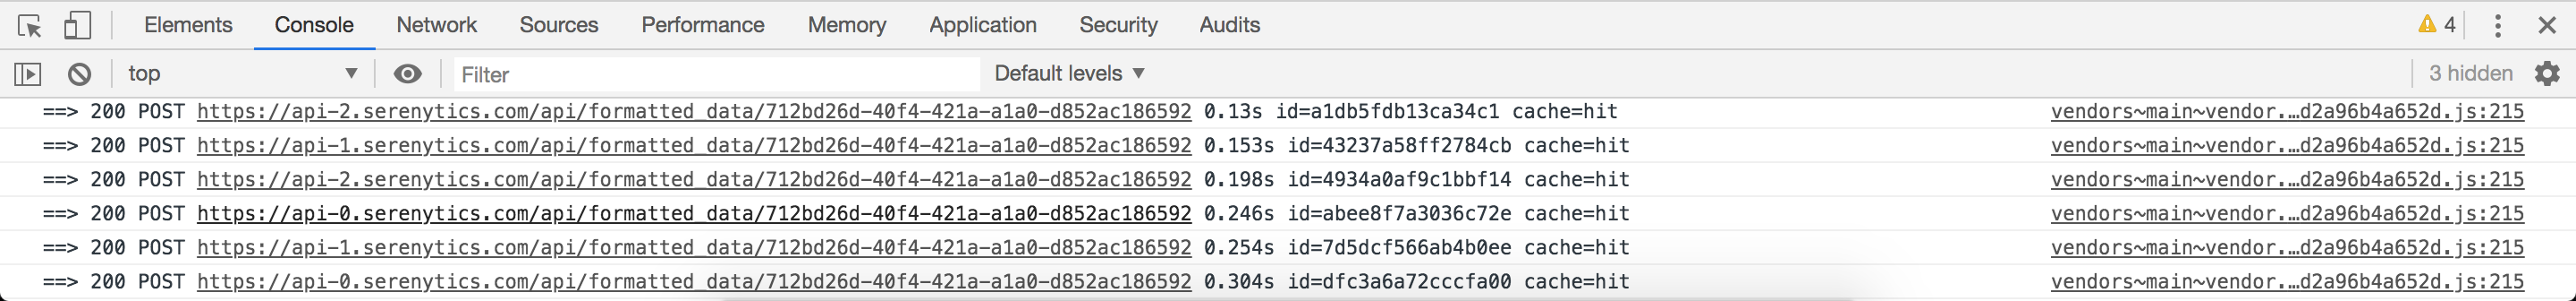
To finely check if the cache is well configured for a dashboard, you need to open the console of your browser (e.g. in Chrome, use the menu View/developer/Javascript console).
The "data queries" in Serenytics are sent to our API "formatted_data". When you reload a dashboard, in the console, all queries will be logged and the "cache=miss" means that the cache was not used for a query: