Dataflows

A dataflow is a set of data transformations that can be represented graphically.
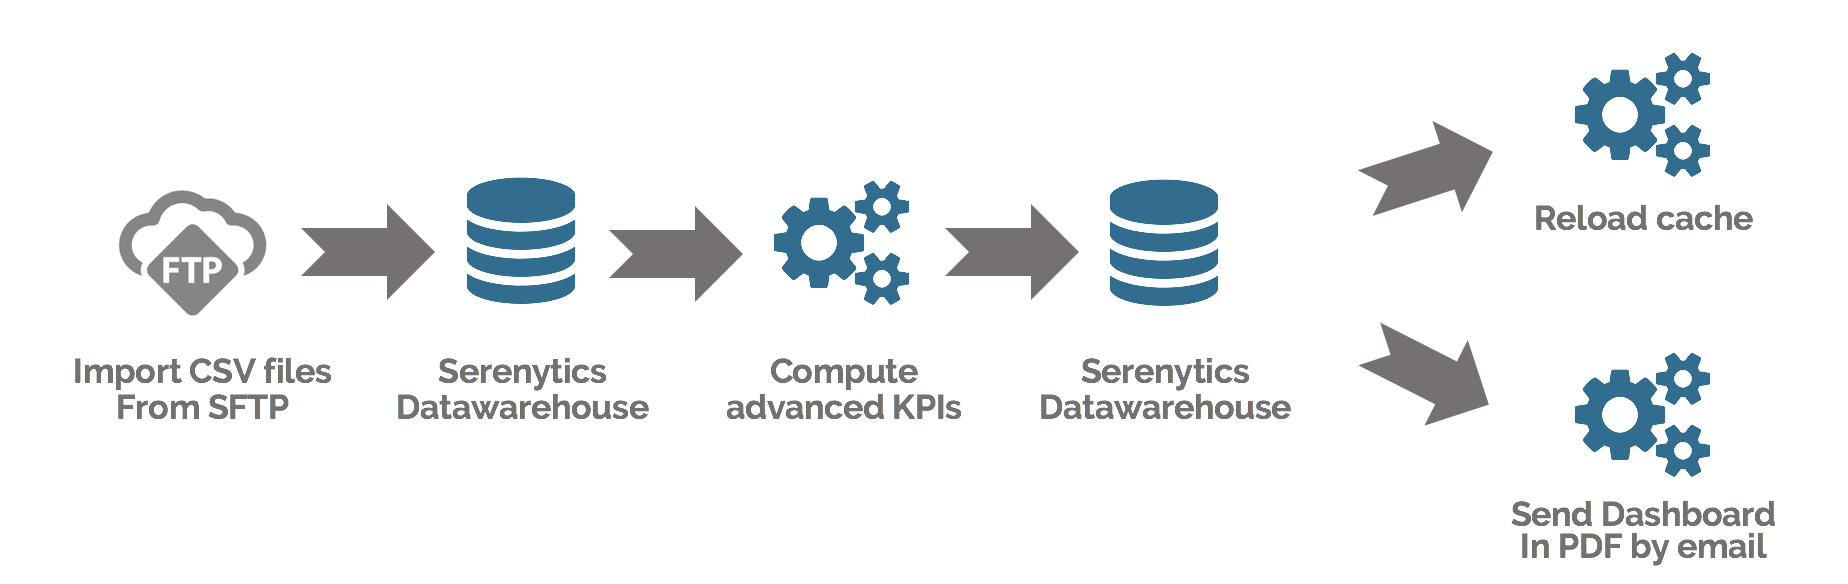
For example, you can load your product database from a CSV file onto an SFTP, then load your customer database and your sales database from SQL tables; then calculate the meta-info for each customer (total turnover, number of purchases, date of last purchase, etc.). Then you can merge the sales with these meta-infos to create a dashboard in which you can filter your sales for customers who have made more than €100 in turnover.
For many projects, this data preparation is necessary. You can do it with a stack of dedicated tools (AWS Redshift, Kestra.io, dbt, Airbyte...) but this requires a high level of technical expertise.
With Serenytics, everything is integrated and easy to use, and is sufficient for many projects.
Dataflows are based on 3 components integrated into Serenytics:
- Data transformation steps (ETL step, Pivot, SFTP upload, Python script, etc.). See below..
- The internal data warehouse to store this data. Learn more.
- The scheduler to automatically triggers the data processing. Learn more.
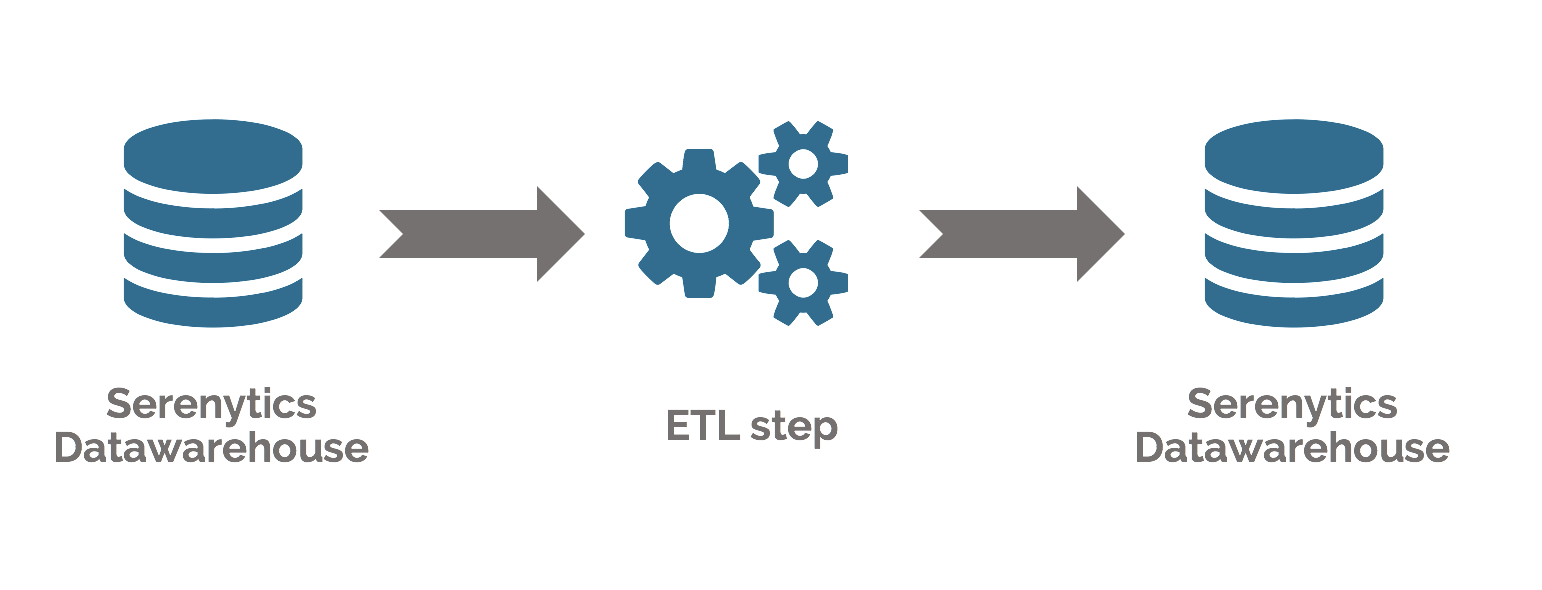
You can configure an ETL step (extract/transform/load) graphically, without writing SQL.
With an ETL step, you can:
- load data from any input datasource,
- define the data transformation to be applied to this data (column selection, aggregation, filtering, calculation of new columns, renaming, etc.)
- store the result of the transformation in a data table in the internal datawarehouse.
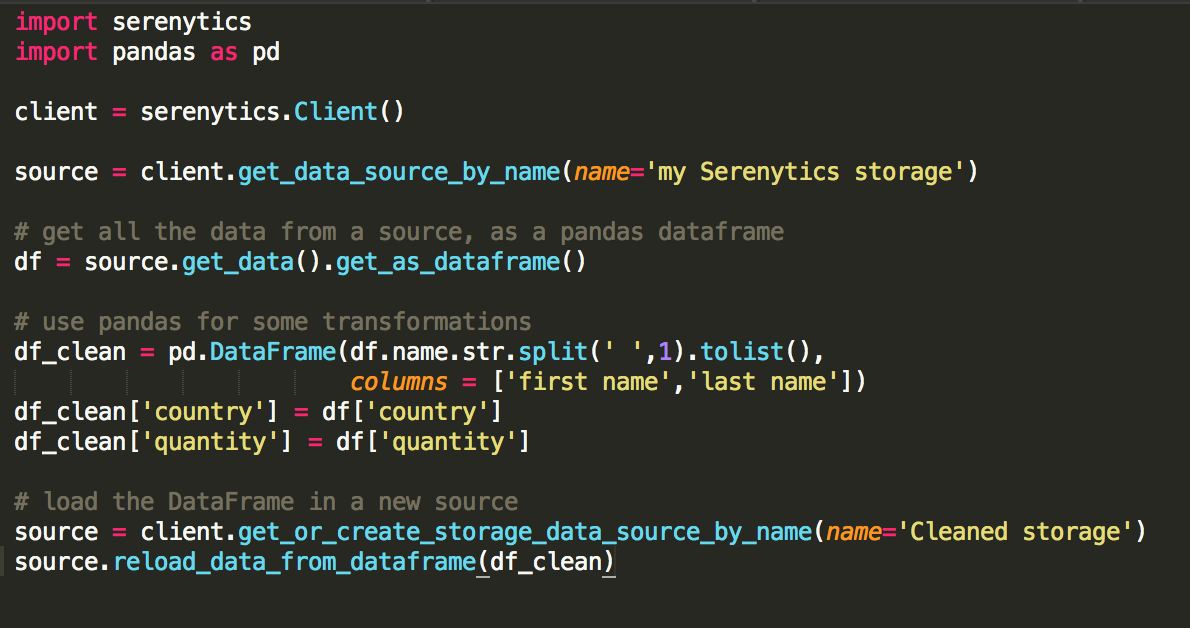
Our platform integrates a Python scripting system. Code all your data processing (import, export, advanced calculations, data cleaning, machine learning, predictive analyses ...) and execute them regularly via our scheduler or by triggering them via a REST API call. You avoid having to manage your own data processing infrastructure.
In a Python script, you can use the Serenytics package. This provides many functions that allow you to query a data source configured in the interface (with aggregates and filtering). The result of this query can be manipulated with the Python language, often using libraries like Pandas or Scikit-learn. Finally, the Serenytics library allows you to load your results into our internal datawarehouse to view the results.
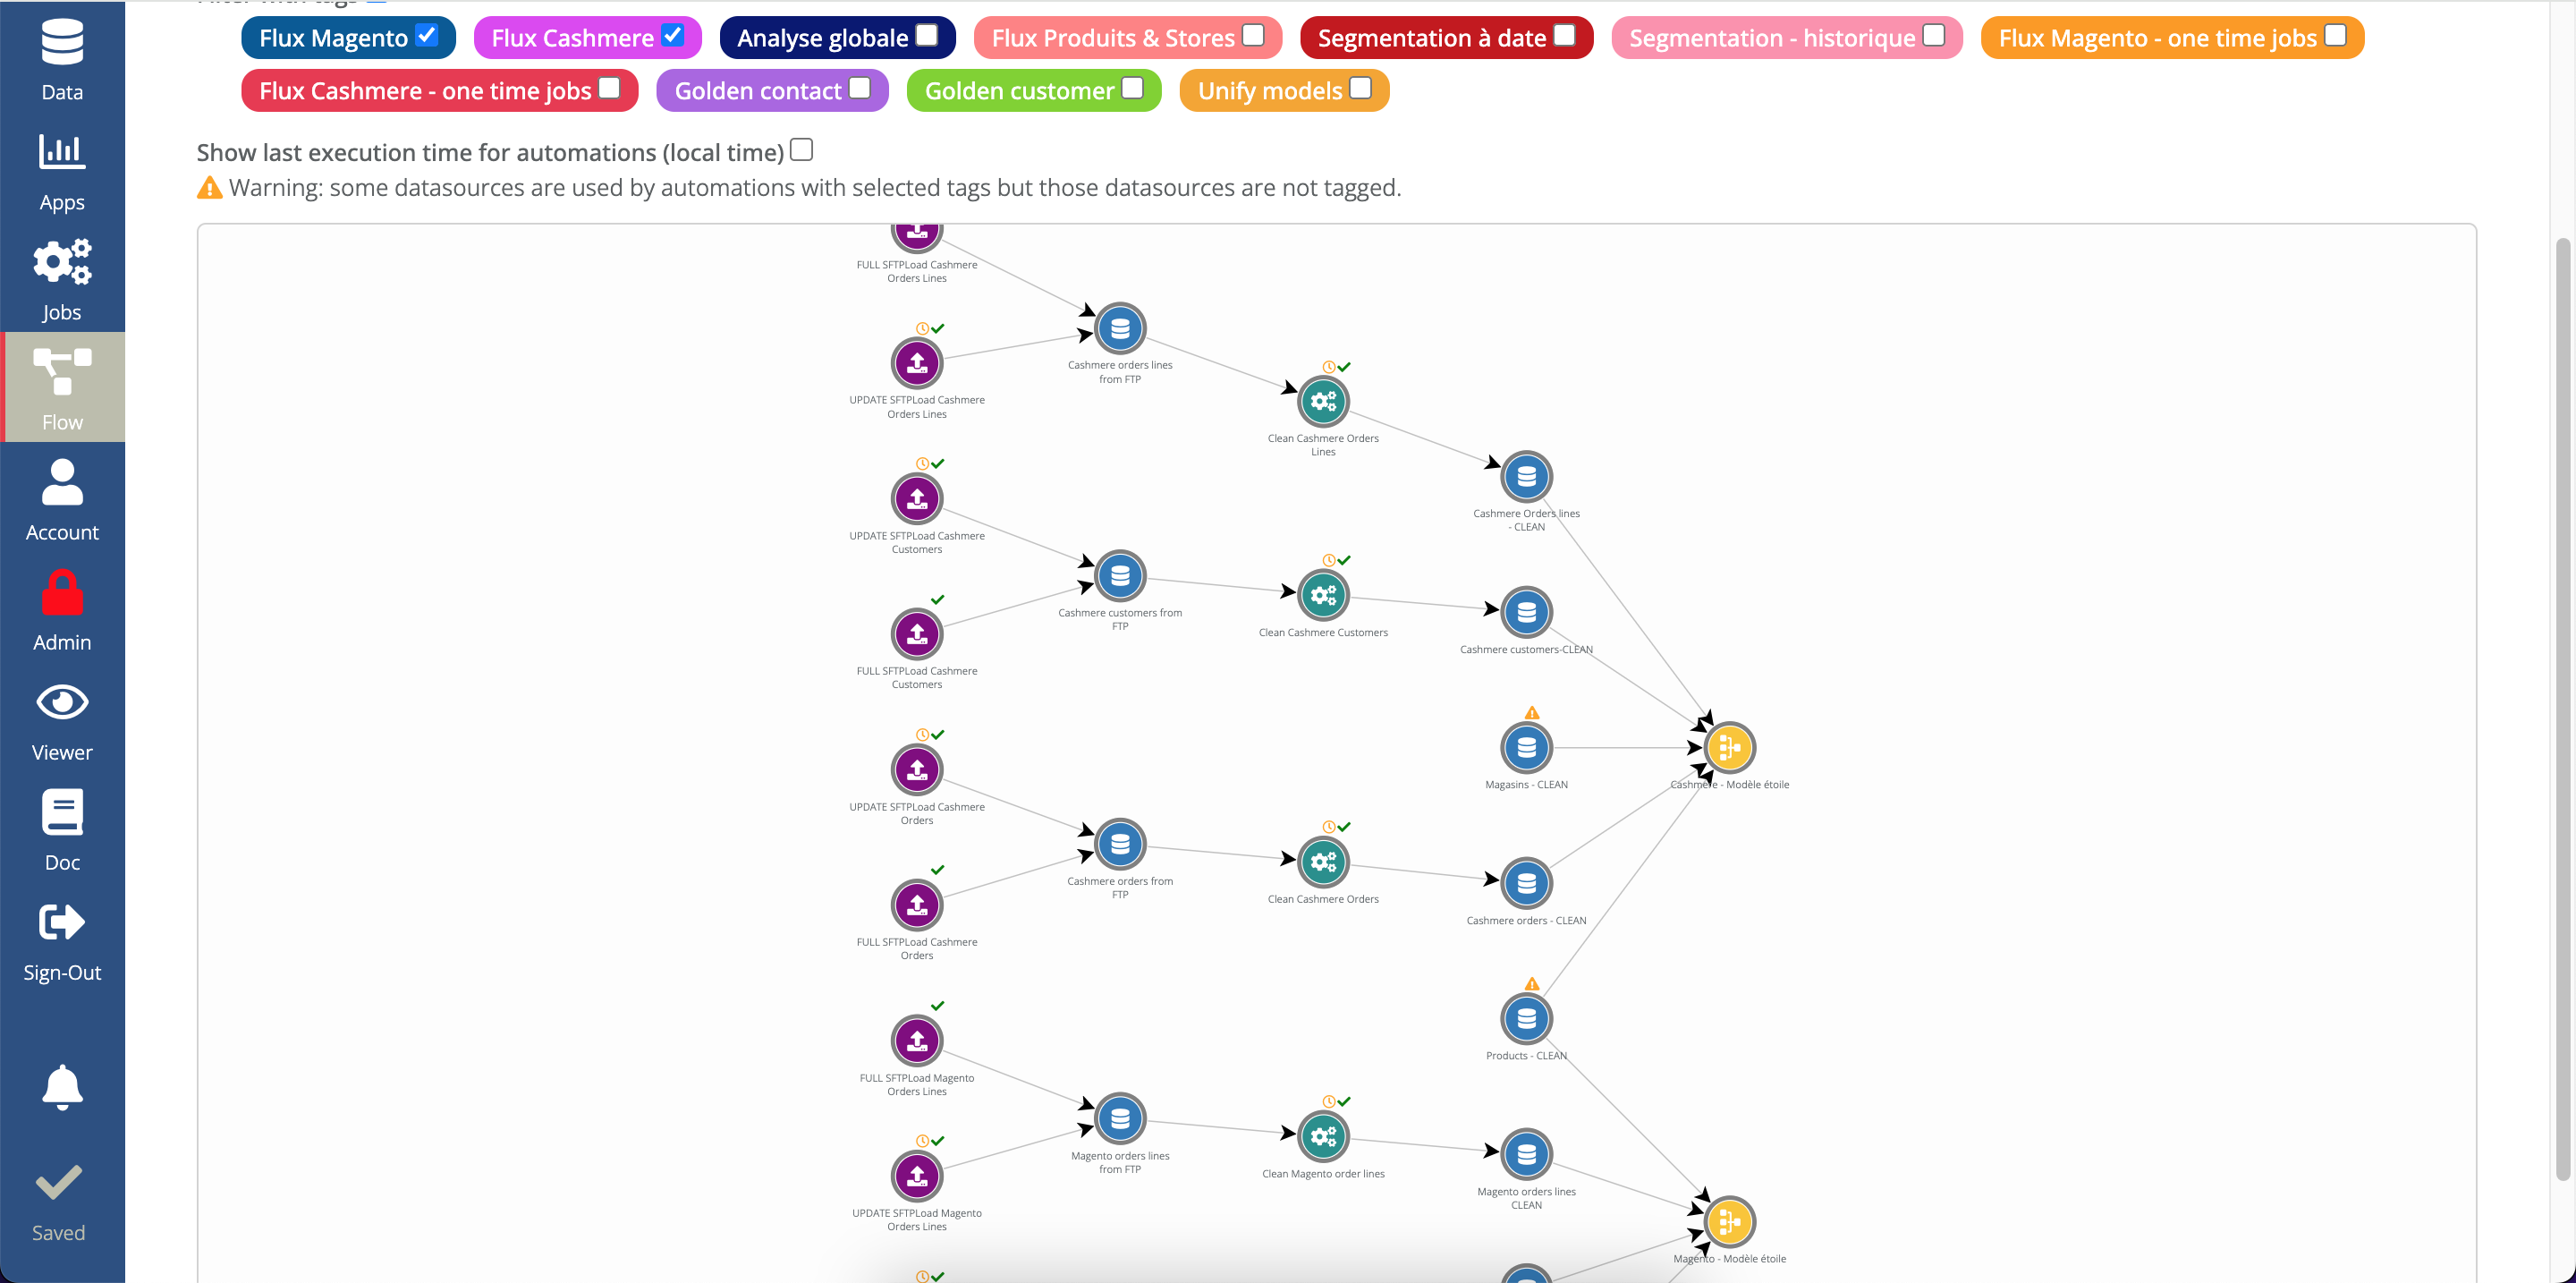
Our engine allows you to create a flow that will sequence several steps (ETL or Python script). With our scheduler, you can schedule the execution of this flow whenever you want.
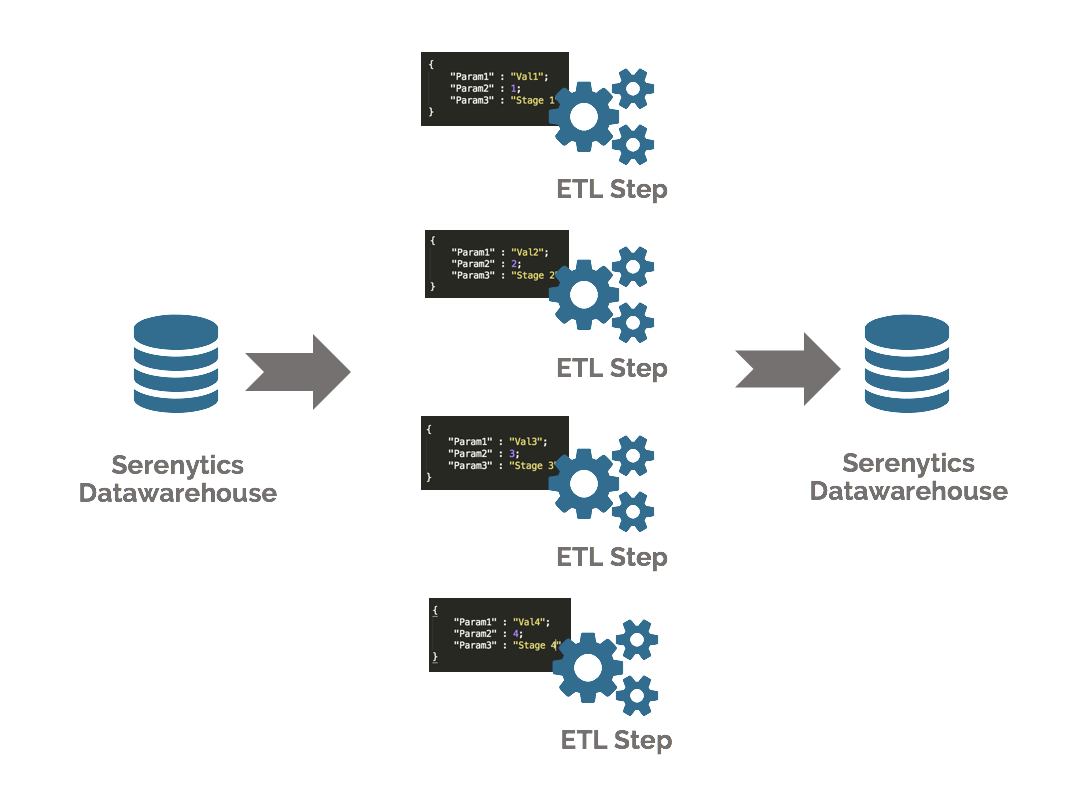
Some formulas are sometimes dependent on a parameter. For example, the function "made a purchase in the last 12 months" depends on the month in which this function is evaluated. To manage this complexity, Serenytics allows you to add parameters to your functions (for example, a "calculation month" parameter) and start calculating your ETL steps several times (once for each parameter value). The results of each execution are concatenated in a table in our internal datawarehouse.
In just a few clicks, you set up very advanced data processing. This allows you, for example, to build the history of the number of active clients in a client database.