How to send filtered PDF dashboards by email
Back to Tutorials

Filtering a dashboard
In this tutorial, you will learn how to send a dashboard in PDF by email to a list of recipients, with the condition that each recipient needs to have the dashboard filtered.
The most common example is a sales dashboard. You want to send it every Monday morning to the sales representatives. But each sales rep must see only his/her region.
Create a template dashboard
The very first step is to create the filtered dashboard. In the Serenytics vocabulary, we call it a template dashboard.
To transform a classical dashboard into a template dashboard, you need to add a global filter on the dashboard using a variable. In the capture below, we created this global filter on the datasource named "Sales data", on the field "Country", with the operator ==, and the variable name is __countryVar__. The {{ and }} are used to specify to our engine that this is a template variable that must be interpreted, and not a standard string.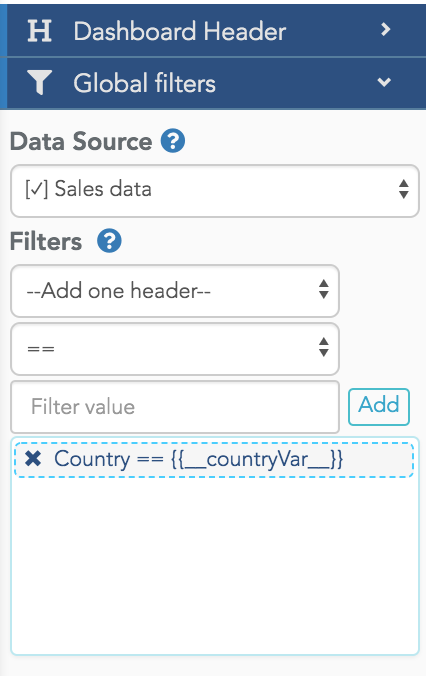 When you add this filter, the widgets of the dashboard using this datasource will display an error message:
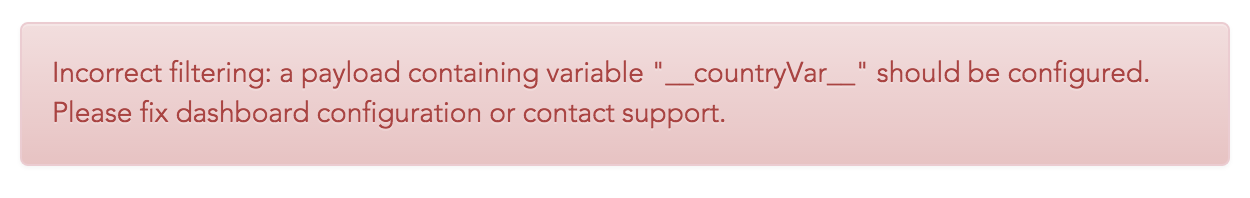 To test your dashboard with variables, you can start by using a "test" payload defined in the dashboard, using the "test payload" section:
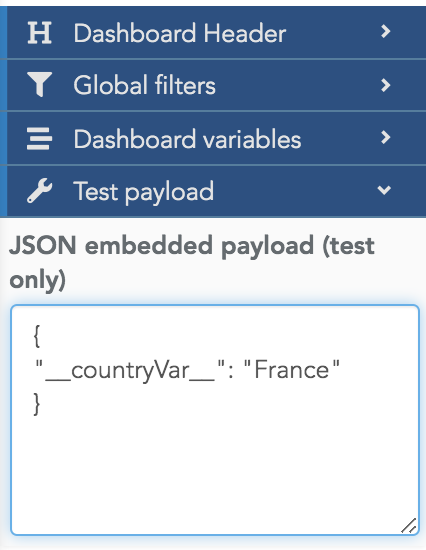 This test payload is only available to help you to create the dashboard. If you open this dashboard in viewer mode, you will still see the errors as the test payload is not passed to the dashboard in this mode. This is also true if you generate a task to send this dashboard in PDF by email.
In the next section, you will learn how to pass the variable values to the dashboard when generating the PDF reports.
Send template dashboards by email
To pass variables to a template dashboard generated in PDF, you need to use the Serenytics Python client (or directly use our API but it is more complicated). The Python code to use in an automation is:
import serenytics
client = serenytics.Client()

WEB_APP_UUID = 'MY_WEBAPP_UUID'  # obtained from the dashboard URL

subject = "Here is your weekly report"
recipients= ['contact@serenytics.com']
html = "Hello,
 please open the attachment to get your PDF report."
web_app_uuid = WEB_APP_UUID

# the payload to filter the dashboard
payload = {
    '__countryVar__': 'FRANCE'
}

client.send_email(subject=subject,
    recipients=recipients,
    html=html,
    web_app_uuid=web_app_uuid,
    dashboard_payload=payload)
Of course, because you are in Python, you can loop through a list of contacts and use a dedicated payload for each one. This list of recipients and their associated filters can also be retrieved from a Serenytics datasource, or from a third-party API. Options are endless.
×![]()